Definition of Bcg Matrix
The Boston Consulting Group (BCG) introduced a growth-share matrix planning tool in 1970 to access the product or services of the company to decide which products to keep, sell, or invest in further.
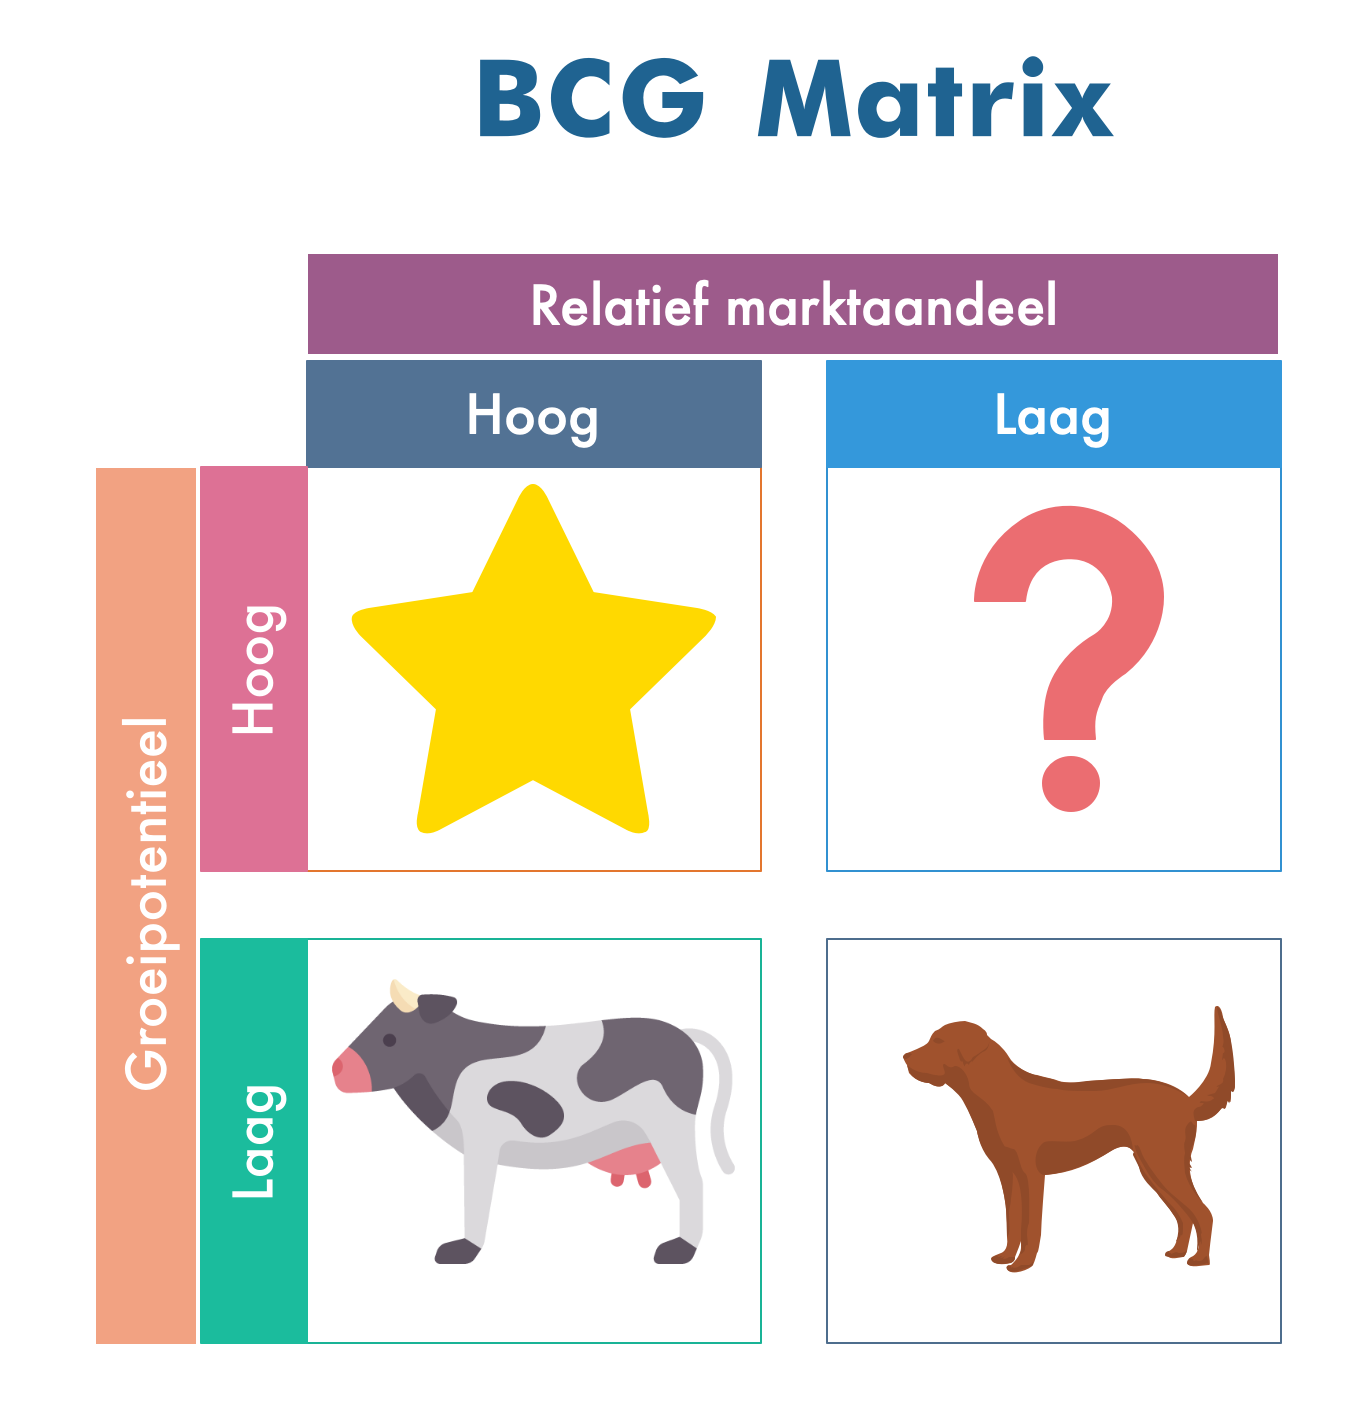
The BCG matrix divide company products into four-square matrix – dogs, cash cows, stars, and question marks. The x-axis of this matrix represents the market share while the y-axis represents the rate of market growth.
The distinct categories of the matrix have the following product categories in it.
- Dogs: Products that not only have a low market share but also have a low growth rate.
- Cash Cows: Products that have a high market share but they have a low growth rate.
- Question Marks: Products that have low market share but relatively a high growth rate.
- Stars: Products that have both high market share and a high growth rate.

Source: Courante
View More Management Definitions
Related Questions of Bcg Matrix
Given the information in the table below, develop a BCG Matrix
Develop a BCG Matrix for your university. Because your college does
Would a BCG Matrix and analysis be worth performing if you do
Prepare a BCG Matrix for a two-division firm with sales
Overlay a BCG Matrix with a Grand Strategy Matrix and discuss similarities
If a firm has the leading market share in its industry,
In a BCG Matrix or the Grand Strategy Matrix, what would
Walt Disney Company has four major strategic business units: movies (
What major limitations of the BCG Matrix does the IE Matrix overcome
How does the BCG matrix help marketers decide which products to offer
Show All

