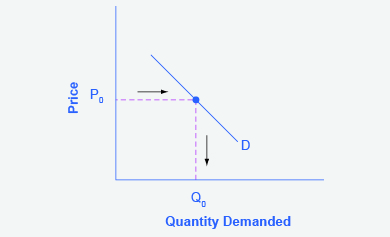
Definition of Demand Curve
A Demand curve is a graphical relationship between the product or services price and the demand for those products or services. Price is represented on the vertical left side while demand is represented on the horizontal right side. The slope goes down which shows when the price is high, the product or services demand is low and vice versa.
The downward slope representation shows that price is an independent variable while demand is a dependent variable.
Example of Demand Curve:
If the price of wheat goes up, people will buy less wheat and buy some rice to balance their food requirements.

Source: Openstax
View More Service Marketing Definitions
Related Questions of Demand Curve
4.1. In Figure 21.6, the taxi
A subsidy is the opposite of a tax. With a $
3.1. Arrow up or down: In Figure 21
A college student has two options for meals: eating at the
Consider how health insurance affects the quantity of healthcare services performed.
Draw a demand curve for turkey. In your diagram, show
Sleek Sneakers Co. is one of many firms in the market
Consider the relationship between monopoly pricing and price elasticity of demand.
It is a hot day, and Bert is thirsty. Here
1.1. For a monopolist, marginal revenue is (
Show All

