Definition of Fish Diagram
The fishbone diagram also is known as the Ishikawa diagram or cause and effect diagram that helps managers to identify the problems or reasons that are causing the problems, defects, or failures in product development. This diagram helps managers to develop a brainstorming session to develop innovative ideas to solve the problems.
This diagram looks like a fish where the problem lies at its head while all possible causes of that problem lie into its spine. Once all possible problems are identified, managers develop the right strategy to resolve all the issues.
This diagram also helps organizations in new product development. Through this diagram, all shortcomings with current market offerings can be measure and innovative solutions can be offered to the market.
Example of Fishbone Diagram:
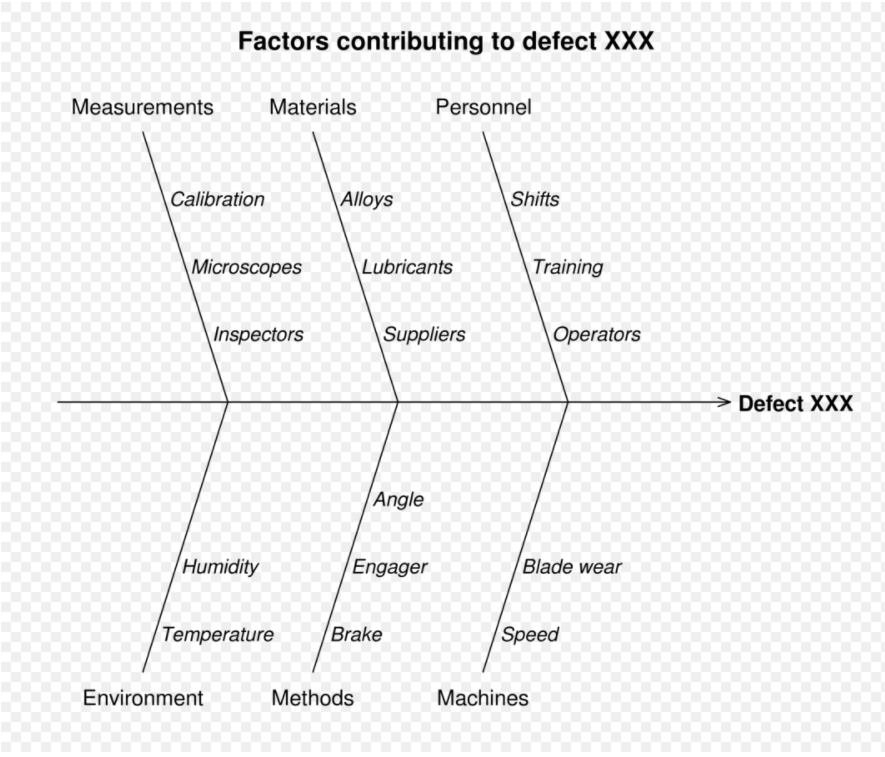
Source: Wikimedia Commons
View More Service Marketing Definitions
Related Questions of Service Marketing
What are the key barriers for firms to break the Cycle of
What is the difference between enhancing and facilitating supplementary services? Give
Explain the three-stage model of service consumption.
Explain the Flower of Service concept and identify each of its petals
Choose an industry you are familiar with (such as cell phone
Describe the building blocks for managing capacity and demand.
Describe how the Mehrabian-Russell Stimulus- Response Model and Russell’s
Which elements of the Services Marketing Communications Mix would you use for
Why is it important to consider the distribution of core and supplementary
“The 4 Ps are all a marketing manager needs to create
Show All

