Question: A bear market is a market condition
A bear market is a market condition in which the price of the security falls. A bear market in the stock market is defined as a condition in which the market declines by 20% or more over the course of at least two months. The following data represent the number of months and percentage change in the S&P500 (a group of 500 stocks).
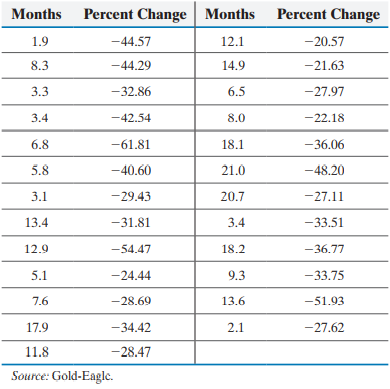
(a) Treating months as the explanatory variable, x, determine the estimates for /
(b) Assuming the residuals are normally distributed, test whether a linear relation exists between the number of months of a bear market and percent change at the = 0.05 level of significance.
(c) Assuming the residuals are normally distributed, construct a 95% confidence interval for the slope of the true least- squares regression line.
(d) Based on your results to parts (b) and (c), would you recommend using the least-squares regression line to predict the percent change in the S&P500 during a bear market? Why?
> An Internet service provider randomly selects 15 residential blocks from a large city and surveys every household in these 15 blocks to determine the number that would use a high-speed Internet service.
> On election day, a pollster for Fox News positions herself outside a polling place near her home and asks the first 50 voters leaving the facility to complete a survey.
> Read the following description of an observational study and determine whether it is a cross-sectional, a case-control, or a cohort study. Explain your choice. The Cancer Prevention Study II (CPS-II) examines the relationship among environmental and life
> A sample of 504 patients in early stages of Alzheimer’s disease is divided into two groups. One group receives an experimental drug; the other receives a placebo. The advance of the disease in the patients from the two groups is tracked at 1-month interv
> A parent group examines 25 randomly selected PG-13 movies and 25 randomly selected PG movies, records the number of sexual innuendos and curse words that occur in each, and then compares the number of sexual innuendos and curse words between the two movi
> Number of siblings
> Discuss the pros and cons of telephone interviews that take place during dinner time in the early evening.
> Stock rating (strong buy, buy, hold, sell, strong sell)
> Marital status
> Birth year
> In the 2019 NCAA Football Championship Game, quarterback Trevor Lawrence completed 62.5% of his passes for a total of 347 yards.
> In a survey of 1011 people age 50 or older, 73% agreed with the statement “I believe in life after death.” Source: Bill Newcott. “Is There Life after Death?,” AARP Magazine, Sept./Oct. 2007.
> Brand name of a pair of running shoes
> Weight in carats of an uncut diamond
> Number of new automobiles sold at a dealership on a given day
> Explain the steps in designing an experiment.
> Use the results of Problem 11 from Section 12.3 to answer the following questions: (a) Predict the mean well-being index composite score of all individuals whose commute time is 20 minutes. (b) Construct a 90% confidence interval for the mean well- being
> What are the advantages of having a presurvey when constructing a questionnaire that has closed questions?
> Using the sample data from Problem 8 in Section 12.3, (a) Predict the mean value of y if x = 1.8. (b) Construct a 95% confidence interval for the mean value of y if x = 1.8. (c) Predict the value of y if x = 1.8. (d) Construct a 95% prediction interval f
> Using the sample data from Problem 7 in Section 12.3, (a) Predict the mean value of y if x = 1.4. (b) Construct a 95% confidence interval for the mean value of y if x = 1.4. (c) Predict the value of y if x = 1.4. (d) Construct a 95% prediction interval f
> Using the sample data from Problem 6 in Section 12.3, (a) Predict the mean value of y if x = 8. (b) Construct a 95% confidence interval for the mean value of y if x = 8. (c) Predict the value of y if x = 8. (d) Construct a 95% prediction interval for the
> Using the sample data from Problem 5 in Section 12.3, (a) Predict the mean value of y if x = 7. (b) Construct a 95% confidence interval for the mean value of y if x = 7. (c) Predict the value of y if x = 7. (d) Construct a 95% prediction interval for the
> Intervals constructed about the predicted value of y, at a given level of x, that are used to measure the accuracy of a single individual’s prediction are called ____ intervals for a(n)____ response.
> Intervals constructed about the predicted value of y, at a given level of x, that are used to measure the accuracy of the mean response of all individuals in the population are called_____ intervals for a(n) ______ response.
> Can a photograph of an individual be used to predict their intelligence? Researchers at Charles University in Prague, Czech Republic, had 160 raters analyze the photos of 80 students and asked each rater to rate the intelligence and attractiveness of the
> The following data represent the speed at which a ball was hit (in miles per hour) and the distance it traveled (in feet) for a random sample of home runs in a Major League baseball game in 2018. (a) Treating speed at which the ball was hit as the explan
> Is the width of a tornado related to the distance for which the tornado is on the ground? Go to www.pearsonhighered.com/sullivanstats to obtain the data file 12_4_17. These data represent the width (in yards) and length (in miles) for tornadoes in Louisi
> Using the results of Problem 20 from Section 12.3, explain why it does not make sense to construct confidence or prediction intervals based on the least-squares regression equation.
> Discuss the benefits of having trained interviewers.
> Using the results of Problem 19 from Section 12.3, explain why it does not make sense to construct confidence or prediction intervals based on the least-squares regression equation.
> American Black Bears Use the results of Problem 18 from Section 12.3 to answer the following questions: (a) Predict the mean weight of American black bears with a total length of 154.5 cm. (b) Construct a 95% confidence interval for the mean weight of Am
> Use the results of Problem 17 in Section 12.3 to answer the following questions: (a) Predict the mean annual ROI of all four-year schools whose cost is $180,000. (b) Construct a 95% confidence interval for the mean annual ROI found in part (a). (c) Predi
> Tar and Nicotine Use the results of Problem 16 in Section 12.3 to answer the following questions: (a) Predict the mean nicotine content of all cigarettes whose tar content is 12 mg. (b) Construct a 95% confidence interval for the tar content found in par
> Use the results of Problem 15 from Section 12.3 to answer the following questions: (a) Predict the mean 28-day strength of concrete whose 7-day strength is 2550 psi. (b) Construct a 95% confidence interval for the mean 28-day strength of concrete whose 7
> Use the results of Problem 14 in Section 12.3 to answer the following questions: (a) Predict the mean wind speed of all hurricanes whose atmospheric pressure is 950 mb. (b) Construct a 95% confidence interval for the mean wind speed found in part (a). (c
> Use the results of Problem 13 from Section 12.3 to answer the following questions: (a) Predict the mean head circumference of children who are 25.75 inches tall. (b) Construct a 95% confidence interval for the mean head circumference of children who are
> Use the results of Problem 12 from Section 12.3 to answer the following questions: (a) Predict the mean interest rate of all individuals whose credit score is 730. (b) Construct a 90% confidence interval for the mean interest rate of all individuals whos
> If /is not rejected, what is the best estimate for the value of the response variable for any value of the explanatory variable?
> In the least-squares regression model, / / is a random error term with mean_____ and standard deviation /
> What are some solutions to nonresponse?
> True or False: In a least-squares regression, the response variable is normally distributed with mean / and standard deviation .
> Suppose a least-squares regression line is given by / = 4.302x - 3.293. What is the mean value of the response variable if x = 20?
> Why don’t we conduct inference on the linear correlation coefficient?
> Why is it desirable to have the explanatory variables spread out to test a hypothesis regarding 1 or to construct confidence intervals about 1?
> What do the y-coordinates on the least-squares regression line represent?
> Why is it important to perform graphical as well as analytical analyses when analyzing relations between two quantitative variables?
> Zillow.com is a site that can be used to assess the value of homes in your neighborhood. The organization provides a list of homes for sale as well as a Zestimate, which is the price Zillow believes the home will sell for. The following data represent th
> The output shown was obtained from Minitab. (a) The least-squares regression equation is / = 1.3962x + 12.396. What is the predicted value of y at x = 10? (b) What is the mean of y at x = 10? (c) The standard error, se, is 2.167. What is an estimate of
> A doctor wanted to determine whether there is a relation between a male’s age and his HDL (so-called good) cholesterol. He randomly selected 17 of his patients and determined their HDL levels. He obtained the following data. (a) Draw a scatter diagram of
> Why is it rare for frames to be completely accurate?
> The following data represent the total compensation for 12 randomly selected chief executive officers (CEOs) and the company’s stock performance in 2017. (a) Treating compensation as the explanatory variable, x, determine the estimates of / (b) Assuming
> In 1969, Dr. Michael R. Pelton of the University of Tennessee initiated a long-term study of the American black bear (Ursus americanus) population in Great Smoky Mountains National Park. One aspect of the study was to develop a model that could be used t
> Go to www.pearsonhighered.com/ sullivanstats to obtain the data file 12_3_17. The variable “Cost” represents the four-year cost including tuition, supplies, room and board, the variable “Annual ROI” represents the return on investment for graduates of th
> Every year the Federal Trade Commission (FTC) must report tar and nicotine levels in cigarettes to Congress. Tar and nicotine levels of over 1200 brands of cigarettes are given to Congress and a random sample of those appear in the following table: (a) T
> As concrete cures, it gains strength. The following data represent the 7-day and 28-day strength (in pounds per square inch) of a certain type of concrete: (a) Treating the 7-day strength as the explanatory variable, x, determine the estimates of / (b) C
> The following data represent the maximum wind speed (in knots) and atmospheric pressure (in millibars) for a random sample of hurricanes that originated in the Atlantic Ocean. Does atmospheric pressure play a role in the wind speed of a hurricane? Use th
> A pediatrician wants to determine the relation that may exist between a child’s height and head circumference. She randomly selects 11 children from her practice, measures their heights and head circumferences, and obtains the following data: Use the res
> An economist wants to determine the relation between one’s FICO score, x, and the interest rate of a 36-month auto loan, y. The data represent the interest rate (in percent) a bank might offer on a 36-month auto loan for various FICO scores. Use the resu
> The following data represent commute times (in minutes) and a score on a well-being survey. Use the results from Problem 17 in Section 4.2 to answer the following questions: (a) Treating commute time as the explanatory variable, x, determine the estimate
>
> One of the challenges in polling for elections is deciding who to include in your frame and who might actually turn out to vote. (a) Suppose you were asked to conduct a poll for a senatorial election. Explain how you might design your sample. In your exp
>
>
>
>
>
> The following table contains observed values and expected values in parentheses for two categorical variables, X and Y, where variable X has three categories and variable Y has two categories. (a) Compute the value of the chi-square test statistic. (b) T
> The following table contains observed values and expected values in parentheses for two categorical variables, X and Y, where variable X has three categories and variable Y has two categories (a) Compute the value of the chi-square test statistic. (b) Te
> In a chi-square test for_______ of proportions, we test whether different populations have the same proportion of individuals with some characteristic.
> True or False: The expected frequencies in a chi-square test for independence are found using the formula
> Why does the test for homogeneity follow the same procedures as the test for independence?
> Research the polling done by George Gallup in the 1936 presidential election. Write a report on your findings and include information about the sampling technique and sample size. Next, research the polling done by Gallup for the 1948 presidential electi
> Goals scored in a season by a soccer player
> Explain the differences between the chi-square test for independence and the chi-square test for homogeneity. What are the similarities?
> Go to www.pearsonhighered.com/sullivanstats to obtain the data file 12_2_24 using the file format of your choice for the version of the text you are using. The variable “TrueDist” represents the distance, in feet, that the homerun traveled for all homeru
> During the fall semester of 2014, the University of North Georgia developed a corequisite College Algebra course. In this approach, students who would otherwise place in a Learning Support (LS) course in one semester and then enroll in College Algebra th
> In a famous study by the Physicians Health Study Group from Harvard University from the late 1980s, 22,000 healthy male physicians were randomly divided into two groups; half the physicians took aspirin every other day, and the others were given a placeb
> Researchers at the City University of New York (CUNY) identified 717 students who originally placed into an Elementary Algebra course. The students agreed to participate in a study related to the roll of corequisite remediation and study skills. In this
> A study by InsuranceQuotes.com found that homeowners with poor credit pay 91% more for home insurance than people with excellent credit. (a) A quote in the article stated, “Insurers have found a direct correlation between a consumer’s credit and the like
> Traditional underwriting to determine the risks associated with lending include credit scores, income, and employment history. The online lender ZestFinance used data analysis to find that people who fill out loan applications using all capital letters d
> In the Sullivan Statistics Survey, respondents were asked to disclose their political affiliation (Democrat, Independent, Republican) and also answer the question: “Would you be willing to pay higher taxes if the tax revenue went directly toward deficit
> A survey was conducted at a community college of 50 randomly selected students who dropped a course in the current semester to learn why students drop courses. “Personal” drop reasons include financial, transportation, family issues, health issues, and
> In a recent survey conducted by the Pew Research Center, a random sample of adults 18 years of age or older living in the continental United States was asked their reaction to the word capitalism. In addition, the individuals were asked to disclose which
> Name two biases that led to the Literary Digest making an incorrect prediction in the presidential election of 1936.
> In a recent survey conducted by the Pew Research Center, a random sample of adults 18 years of age or older living in the continental United States was asked their reaction to the word socialism. In addition, the individuals were asked to disclose which
> Celebrex, a drug manufactured by Pfizer, Inc., is used to relieve symptoms associated with osteoarthritis and rheumatoid arthritis in adults. In clinical trials of the medication, some subjects reported dizziness as a side effect. The researchers wanted
> Do electronic cigarettes assist in helping individuals quit smoking? Researchers found 300 current smokers to volunteer for a study in which each was randomly assigned to one of three treatment groups. Group 1 received an electronic cigarette (e-cig) in
> The following data represent the smoking status from a random sample of 1054 U.S. residents 18 years or older by level of education. (a) Test whether smoking status and level of education are independent at the = 0.05 level of significance. (b) Constru
> The Gallup Organization conducted a survey asking individuals questions pertaining to social well-being such as strength of relationship with spouse, partner, or closest friend, making time for trips or vacations, and having someone who encourages them t
> Does amount of education play a role in the healthiness of an individual? The following data represent the level of health and the highest degree earned for a random sample of individuals from the General Social Survey. (a) Does the evidence suggest that
> Are health and happiness related? The following data represent the level of happiness and level of health for a random sample of individuals from the General Social Survey. (a) Does the evidence suggest that health and happiness are related? Use the =
> An obstetrician wants to learn whether the amount of prenatal care and the wantedness of the pregnancy are associated. He randomly selects 939 women who had recently given birth and asks them to disclose whether their pregnancy was intended, unintended,
> A sociologist wants to discover whether the sexual activity of females between the ages of 15 and 19 years and family structure are associated. She randomly selects 380 females between the ages of 15 and 19 years and asks each to disclose her family stru
> The following table contains the number of successes and failures for three categories of a variable. Test whether the proportions are equal for each category at the = 0.01 level of significance.
> People often respond to survey questions without any knowledge of the subject matter. A common example of this is the discussion on banning dihydrogen monoxide. The Centers for Disease Control (CDC) reports that there were 1423 deaths due to asbestos in
> The following table contains the number of successes and failures for three categories of a variable. Test whether the proportions are equal for each category at the = 0.01 level of significance.
> A_______ test is an inferential procedure used to determine whether a frequency distribution follows a specific distribution.
> True or False: The shape of the chi-square distribution depends on the degrees of freedom.
> A “nine-ender” is an individual whose age ends in 9 (as in 29, 39, 49 years of age). Some studies have suggested that nine-enders tend to participate in certain activities at a higher rate than those whose age ends in the digits 0 through 8. For example,
> If the expected count of a category is less than 1, what can be done to the categories so that a goodness-of-fit test can still be performed?

