Question: A variable x of a finite population
A variable x of a finite population has the following frequency distribution:
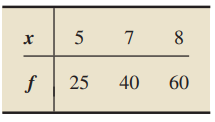
Suppose a member is selected at random from the population and let X denote the value of the variable x for the member obtained.
a. Determine the probability distribution of the random variable X.
b. Use random-variable notation to describe the events that X takes on the value 6, a value of at most 6, and a value greater than 6.
c. Find P(X = 6), P(X ≤ 6), and P(X > 6). Interpret your results.
d. Construct a probability histogram for the random variable X.
> Let X be a discrete random variable with a finite number of possible values, say, x1, x2, ..., xm. For convenience, set pk = P(X = xk ), for k = 1, 2, ..., m. Think of a horizontal axis as a seesaw and each pk as a mass placed at point xk on the seesaw.
> Benny’s Barber Shop in Cleveland has five chairs for waiting customers. The number of customers waiting is a random variable Y with the following probability distribution. a. Compute and interpret the mean of the random variable Y. b. In a large number o
> Students in the dormitories of a university in the state of New York live in clusters of four double rooms, called suites. There are 48 suites, with eight students per suite. a. Describe a cluster sampling procedure for obtaining a sample of 24 dormitory
> Let X be the value of a randomly selected decimal digit, that is, a whole number between 0 and 9, inclusive. a. Use simulation to estimate the mean of X. Explain your reasoning. b. Obtain the exact mean of X by applying Definition.
> A factory manager collected data on the number of equipment breakdowns per day. From those data, she derived the probability distribution shown in the following table, where W denotes the number of breakdowns on a given day. a. Determine μW and σW . Roun
> One method for deciding among various investments involves the concept of expected utility. Economists describe the importance of various levels of wealth by using utility functions. For instance, in most cases, a single dollar is more important (has gre
> An insurance company wants to design a homeowner’s policy for mid-priced homes. From data compiled by the company, it is known that the annual claim amount, X, in thousands of dollars, per homeowner is a random variable with the following probability dis
> Apply the empirical rule to solve each exercise. The data set has size 50. Approximately how many observations lie within one standard deviation to either side of the mean?
> Use the specified grouping method to a. determine a frequency distribution. b. obtain a relative-frequency distribution. c. construct a frequency histogram based on your result from part (a). d. construct a relative-frequency histogram based on your resu
> An investor plans to put $50,000 in one of four investments. The return on each investment depends on whether next year’s economy is strong or weak. The following table summarizes the possible payoffs, in dollars, for the four investments. Let V, W, X, a
> An American roulette wheel contains 38 numbers: 18 are red, 18 are black, and 2 are green. When the roulette wheel is spun, the ball is equally likely to land on any of the 38 numbers. Suppose that you bet $1 on red. If the ball lands on a red number, yo
> The technology consultancy Data Genetics published the online document PIN analysis. In addition to analyzing PIN numbers, passwords trends were examined. Seven million all-numeric passwords were collected and yielded the following estimate of the probab
> An ordinary deck of playing cards has 52 cards. There are four suits—spades, hearts, diamonds, and clubs— with 13 cards in each suit. Spades and clubs are black; hearts and diamonds are red. If one of these cards is selected at random, what is the probab
> An archer shoots an arrow into a square target 6 feet on a side whose center we call the origin. The outcome of this random experiment is the point in the target hit by the arrow. The archer scores 10 points if she hits the bull’s eye—a disk of radius 1
> The World Series in baseball is won by the first team to win four games (ignoring the 1903 and 1919–1921 World Series, when it was a best of nine). From the document World Series History on the Baseball Almanac website, as of November 2013, the lengths o
> In the game of keno, 20 balls are selected at random from 80 balls numbered 1–80. In Exercise 1.48 on page 16, you used simple random sampling to simulate one game of keno. a. Use systematic random sampling to obtain a sample of 20 of the 80 balls. b. Wh
> At the beginning of this chapter, we discussed research by J. Sholl et al. on the relationship between gender and sense of direction. Recall that, in their study, the spatial orientation skills of 30 male and 30 female students were challenged in a woode
> The random variable Y is the sum of the dice when two balanced dice are rolled. Its probability distribution is as follows. a. Find and interpret the mean of the random variable. b. Obtain the standard deviation of the random variable by using one of the
> The random variable X is the number of girls of four children born to a couple that is equally likely to have either a boy or a girl. Its probability distribution is as follows. a. Find and interpret the mean of the random variable. b. Obtain the standar
> Regarding simple random sampling: a. What is simple random sampling? b. What is a simple random sample? c. Identify two forms of simple random sampling and explain the difference between the two.
> The random variable Y is the number of major hurricanes for a randomly selected year between 1851 and 2012. Its probability distribution is as follows. a. Find and interpret the mean of the random variable. b. Obtain the standard deviation of the random
> The random variable Y is the number of persons living in a randomly selected occupied housing unit. Its probability distribution is as follows. a. Find and interpret the mean of the random variable. b. Obtain the standard deviation of the random variable
> The random variable X is the crew size of a randomly selected shuttle mission between April 12, 1981 and July 8, 2011. Its probability distribution is as follows. a. Find and interpret the mean of the random variable. b. Obtain the standard deviation of
> a. Find the mean of the random variable. b. Obtain the standard deviation of the random variable by using one of the formulas given in Definition 5.10.
> a. Find the mean of the random variable. b. Obtain the standard deviation of the random variable by using one of the formulas given in Definition 5.10.
> a. Find the mean of the random variable. b. Obtain the standard deviation of the random variable by using one of the formulas given in Definition 5.10.
> Refer to Table 5.1. a. List the possible samples without replacement of size 4 that can be obtained from the population of five officials. If a simple random sample without replacement of four officials is taken from the five officials, determine the pro
> a. Find the mean of the random variable. b. Obtain the standard deviation of the random variable by using one of the formulas given in Definition 5.10.
> You used simple random sampling to obtain a sample of 10 firms from Fortune Magazine’s list of “The International 500.” a. Use systematic random sampling to accomplish that same task. b. Which method is easier: simple random sampling or systematic random
> Suppose that the random variables X and Y represent the amount of return on two different investments. Further suppose that the mean of X equals the mean of Y but that the standard deviation of X is greater than the standard deviation of Y. a. On average
> We discussed Texas hold’em and described the basic rules of the game. Here we examine some of the simplest probabilities associated with the game. Recall that, to begin, each player is dealt 2 cards face down, called “hole cards,” from an ordinary deck o
> What concept does the mean of a discrete random variable Generalize?
> Refer to the probability distribution displayed in Table 5.11 on page 222. a. Use the technology of your choice to repeat. b. Obtain the proportions for the number of heads in three tosses and compare them to the probability distribution in Table 5.11. c
> Let c > 0 and 0 ≤ α ≤ 1. Also let X, Y, and T be random variables. a. If P(X > c) = α, determine P(X ≤ c) in terms of α. b. Suppose that P(Y > c) = α/2 and P(Y < −c) = P(Y > c). Determine P(−c ≤ Y ≤ c) in terms of α. c. Suppose that P(−c ≤ T ≤ c) = 1 − α
> Suppose that T and Z are random variables. a. If P(T > 2.02) = 0.05 and P(T < −2.02) = 0.05, determine P(−2.02 ≤ T ≤ 2.02). b. Suppose that P(−1.64 ≤ Z ≤ 1.64) = 0.90 and also suppose that P(Z > 1.64) = P(Z < −1.64). Find P(Z > 1.64).
> Suppose that P(Z > 1.96) = 0.025. Find P(Z ≤ 1.96).
> The technology consultancy Data Genetics published the online document PIN analysis. In addition to analyzing PIN numbers, password trends were examined. Seven million all-numeric passwords were collected and yielded the following estimate of the probabi
> In the article “Reproductive Ecology and Cub Survival of Florida Black Bears” (Journal of Wildlife Management, Vol. 71, Issue 3, pp. 720–727), E. Garrison et al. investigated cub survival rates of the Florida black bear. Through the observation of female
> The World Almanac provides information on past and projected total solar eclipses from 1955 to 2015. Unlike total lunar eclipses, observing a total solar eclipse from Earth is rare because it can be seen along only a very narrow path and for only a short
> Refer to Table 5.1. a. List the possible samples without replacement of size 3 that can be obtained from the population of five officials. If a simple random sample without replacement of three officials is taken from the five officials, determine the pr
> During one year, a university wanted to gauge the sentiment of the people using the university’s parking facilities. Each of the 8493 people that used the parking facilities had a sticker with a unique number between 1 and 8493. The university committee
> Apply the empirical rule to solve each exercise. The data set has size 60. Approximately how many observations lie within three standard deviations to either side of the mean?
> An archer shoots an arrow into a square target 6 feet on a side whose center we call the origin. The outcome of this random experiment is the point in the target hit by the arrow. The archer scores 10 points if she hits the bull’s eye—a disk of radius 1
> The World Series in baseball is won by the first team to win four games (ignoring the 1903 and 1919–1921 World Series, when it was a best of nine). Thus, it takes at least four games and no more than seven games to establish a winner. From the document W
> When two balanced dice are rolled, 36 equally likely outcomes are possible. Let Y denote the sum of the dice. a. What are the possible values of the random variable Y? b. Use random-variable notation to represent the event that the sum of the dice is 7.
> A certain couple is equally likely to have either a boy or a girl. If the family has four children, let X denote the number of girls. a. Identify the possible values of the random variable X. b. Determine the probability distribution of X. Use random-var
> The Atlantic Hurricane Database extends back to 1851, recording among other things the number of major hurricanes striking the U.S. Atlantic and Gulf Coast per year. A major hurricane is a hurricane measuring at least a Category 3 on the Saffir-Simpson h
> From the document American Housing Survey for the United States, published by the U.S. Census Bureau, we obtained the following frequency distribution for the number of persons per occupied housing unit, where we have used “7” in place of “7 or more.” Fr
> The National Aeronautics and Space Administration (NASA) compiles data on space-shuttle launches and publishes them on its website. The following table displays a frequency distribution for the number of crew members on each shuttle mission from April 12
> A variable y of a finite population has the following frequency distribution: Suppose a member is selected at random from the population and let Y denote the value of the variable y for the member obtained. a. Determine the probability distribution of th
> A variable y of a finite population has the following frequency distribution: Suppose a member is selected at random from the population and let Y denote the value of the variable y for the member obtained. a. Determine the probability distribution of th
> Apply the empirical rule to solve each exercise. The data set has size 80. Approximately how many observations lie within two standard deviations to either side of the mean?
> In the article, “Reasons for Non-uptake of Measles, Mumps, and Rubella Catch Up Immunization in a Measles Epidemic and Side Effects of the Vaccine” (British Medical Journal, Vol. 310, pp. 1629–1632), R. Roberts et al. discussed a follow-up survey to exam
> Which of the following numbers could not possibly be a probability? Justify your answer. a. 5/6 b. 3.5 c. 0
> A variable x of a finite population has the following frequency distribution: Suppose a member is selected at random from the population and let X denote the value of the variable x for the member obtained. a. Determine the probability distribution of th
> What rule of probability permits you to obtain any probability for a discrete random variable by simply knowing its probability distribution?
> Suppose that you make a large number of independent observations of a random variable and then construct a table giving the possible values of the random variable and the proportion of times each value occurs. What will this table resemble?
> Fill in the blank. For a discrete random variable, the sum of the probabilities of its possible values equals ___ .
> Let X denote the number of siblings of a randomly selected student. Explain the difference between {X = 3} and P(X = 3).
> Provide an example (other than one discussed in the text) of a random variable that does not arise from a quantitative variable of a finite population in the context of randomness.
> Fill in the blanks. a. A relative-frequency distribution is to a variable as a ____ distribution is to a random variable. b. A relative-frequency histogram is to a variable as a____ histogram is to a random variable.
> The general addition rule for two events is presented and that for three events. a. Verify the general addition rule for three events. b. Write the general addition rule for four events and explain your reasoning.
> Apply the empirical rule to solve each exercise. The data set has size 40. Approximately how many observations lie within two standard deviations to either side of the mean?
> A certain city has three major newspapers, the Times, the Herald, and the Examiner. Circulation information indicates that 47.0% of households get the Times, 33.4% get the Herald, 34.6% get the Examiner, 11.9% get the Times and the Herald, 15.1% get the
> In the article, “Non-probability Sampling Designs for Litigation Surveys (Trademark Reporter, Vol. 81, pp. 169–179), J. Jacoby and H. Handlin discussed the controversy about whether nonprobability samples are acceptable as evidence in litigation. The aut
> Suppose that A and B are mutually exclusive events. a. Use the special addition rule to express P(A or B) in terms of P(A) and P(B). b. Show that the general addition rule gives the same answer as that in part (a).
> Which of the following numbers could not possibly be a probability? Justify your answer. a. 0.462 b. −0.201 c. 1
> Roughly speaking, what is an experiment? an event?
> Following are the age and price data for Corvettes. a. compute SST, SSR, and SSE. b. compute the coefficient of determination, r 2. c. determine the percentage of variation in the observed values of the response variable explained by the regression, and
> Following are the data on percentage of investments in energy securities and tax efficiency. a. compute SST, SSR, and SSE. b. compute the coefficient of determination, r 2. c. determine the percentage of variation in the observed values of the response v
> a. compute the three sums of squares, SST, SSR, and SSE, using the defining formulas. b. verify the regression identity, SST = SSR + SSE. c. compute the coefficient of determination. d. determine the percentage of variation in the observed values of the
> a. compute the three sums of squares, SST, SSR, and SSE, using the defining formulas. b. verify the regression identity, SST = SSR + SSE. c. compute the coefficient of determination. d. determine the percentage of variation in the observed values of the
> a. compute the three sums of squares, SST, SSR, and SSE, using the defining formulas. b. verify the regression identity, SST = SSR + SSE. c. compute the coefficient of determination. d. determine the percentage of variation in the observed values of the
> Apply the empirical rule to solve each exercise. The data set has mean 30 and standard deviation 4. Approximately what percentage of the observations lie between 22 and 38?
> a. compute the three sums of squares, SST, SSR, and SSE, using the defining formulas. b. verify the regression identity, SST = SSR + SSE. c. compute the coefficient of determination. d. determine the percentage of variation in the observed values of the
> a. compute the three sums of squares, SST, SSR, and SSE, using the defining formulas. b. verify the regression identity, SST = SSR + SSE. c. compute the coefficient of determination. d. determine the percentage of variation in the observed values of the
> In one of his books, Ted Sorenson, Special Counsel to President John F. Kennedy, presents an intimate biography of the extraordinary man. According to Sorenson, Kennedy “read every fiftieth letter of the thirty thousand coming weekly to the White House.”
> a. compute the three sums of squares, SST, SSR, and SSE, using the defining formulas. b. verify the regression identity, SST = SSR + SSE. c. compute the coefficient of determination. d. determine the percentage of variation in the observed values of the
> a. compute the three sums of squares, SST, SSR, and SSE, using the defining formulas. b. verify the regression identity, SST = SSR + SSE. c. compute the coefficient of determination. d. determine the percentage of variation in the observed values of the
> a. compute the three sums of squares, SST, SSR, and SSE, using the defining formulas. b. verify the regression identity, SST = SSR + SSE. c. compute the coefficient of determination. d. determine the percentage of variation in the observed values of the
> y = 0.5x − 2 a. find the y-intercept and slope. b. determine whether the line slopes upward, slopes downward, or is horizontal, without graphing the equation. c. use two points to graph the equation.
> a. compute the three sums of squares, SST, SSR, and SSE, using the defining formulas. b. verify the regression identity, SST = SSR + SSE. c. compute the coefficient of determination. d. determine the percentage of variation in the observed values of the
> a. compute the three sums of squares, SST, SSR, and SSE, using the defining formulas. b. verify the regression identity, SST = SSR + SSE. c. compute the coefficient of determination. d. determine the percentage of variation in the observed values of the
> For a regression analysis, SST = 8291.0 and SSR = 7626.6. a. Obtain and interpret the coefficient of determination. b. Determine SSE.
> Apply the empirical rule to solve each exercise. The data set has mean 15 and standard deviation 2. Approximately what percentage of the observations lie between 13 and 17
> A measure of the amount of variation in the observed values of the response variable not explained by the regression is the ___. The mathematical abbreviation for it is ___.
> A measure of the amount of variation in the observed values of the response variable explained by the regression is the ___. The mathematical abbreviation for it is ____.
> A measure of total variation in the observed values of the response variable is the ___. The mathematical abbreviation for it is ___.
> The National Agricultural Statistics Service (NASS) conducts studies of the number of acres devoted to farms in each county of the United States. Suppose that we divide the United States into the four census regions (Northeast, North Central, South, and
> In this section, we introduced a descriptive measure of the utility of the regression equation for making predictions. a. Identify the term and symbol for that descriptive measure. b. Provide an interpretation.
> A collection of observations of a variable y taken at regular intervals over time is called a time series. Economic data and electrical signals are examples of time series. We can think of a time series as providing data points (xi, yi), where xi is the
> For a set of n data points, the sample covariance, sxy, is given by The sample covariance can be used as an alternative method for finding the slope and y intercept of a regression line. The formulas are where sx denotes the sample standard deviation of
> The ability to estimate the volume of a tree based on a simple measurement, such as the tree’s diameter, is important to the lumber industry, ecologists, and conservationists. Data on volume, in cubic feet, and diameter at breast height, in inches, for 7
> y = −8 − 4x a. find the y-intercept and slope. b. determine whether the line slopes upward, slopes downward, or is horizontal, without graphing the equation. c. use two points to graph the equation.
> An issue of BARRON’S presented information on top wealth managers in the United States, based on individual clients with accounts of $1 million or more. Data were given for various variables, two of which were number of private client managers and privat
> Apply the empirical rule to solve each exercise. The data set has mean 25 and standard deviation 5. Fill in the following blanks: a. Approximately 68% of the observations lie. b. Approximately 95% of the observations lie. c. Approximately 99.7% of the ob
> The magazine Consumer Reports publishes information on automobile gas mileage and variables that affect gas mileage. In one issue, data on gas mileage (in miles per gallon) and engine displacement (in liters) were published for 121 vehicles. Those data a
> Does a higher state per capita income equate to a higher per capita beer consumption? From the document Survey of Current Business, published by the U.S. Bureau of Economic Analysis, and from the Brewer’s Almanac, published by the Beer Institute, we obta
> Polychlorinated biphenyls (PCBs), industrial pollutants, are known to be carcinogens and a great danger to natural ecosystems. As a result of several studies, PCB production was banned in the United States in 1979 and by the Stockholm Convention on Persi
> The National Oceanic and Atmospheric Administration publishes temperature information of cities around the world in Climates of the World. A random sample of 50 cities gave the data on average high and low temperatures in January shown on the WeissStats

