Question: According to Scarborough Research, more than 85%
According to Scarborough Research, more than 85% of working adults commute by car. Of all U.S. cities, Washington, D.C., and New York City have the longest commute times. A sample of 30 commuters in the Washington, D.C., area yielded the following commute times, in minutes.
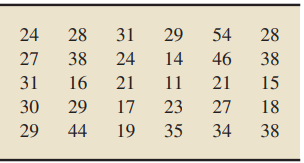
Find and interpret a 90% confidence interval for the mean commute time of all commuters in Washington, D.C.
> What is meant by saying that a statistical procedure is robust?
> Refer to Procedure. a. Explain in detail the assumptions required for using the z-interval procedure. b. How important is the normality assumption? Explain your answer.
> For what is normal population an abbreviation?
> In developing Procedure 8.1, we assumed that the variable under consideration is normally distributed. a. Explain why we needed that assumption. b. Explain why the procedure yields an approximately correct confidence interval for large samples, regardles
> When estimating an unknown parameter, what does the margin of error indicate?
> What is meant by saying that a 1 − α confidence interval is a. exact? b. approximately correct?
> Find the confidence level and α for a. an 85% confidence interval. b. a 95% confidence interval.
> Find the confidence level and α for a. a 90% confidence interval. b. a 99% confidence interval.
> Construct a relative-frequency polygon for the speed data given in Exercise 2.89. Use the classes specified in that exercise. Data from Exercise 2.89: Use the specified grouping method to a. determine a frequency distribution. b. obtain a relative-frequ
> Use the data in Table 8.1 on page 315 to obtain a 68% confidence interval for the mean price of all new mobile homes.
> Use the data in Table 8.1 to obtain a 99.7% confidence interval for the mean price of all new mobile homes.
> Information on serum total cholesterol level is published by the Centers for Disease Control and Prevention in National Health and Nutrition Examination Survey. A simple random sample of 12 U.S. females 20 years old or older provided the following data o
> A tarantula has two body parts. The anterior part of the body is covered above by a shell, or carapace. In the paper “Reproductive Biology of Uruguayan Theraphosids” (The Journal of Arachnology, Vol. 30, No. 3, pp. 571–587), F. Costa and F. Perez–Miles d
> The American Express Retail Index provides information on budget amounts for home improvements. The following table displays the budgets, in dollars, of 45 randomly sampled home improvement jobs in the United States. a. Determine a point estimate for the
> Consumer Reports provides information on new automobile models—including price, mileage ratings, engine size, body size, and indicators of features. A simple random sample of 35 new models yielded the following data on fuel tank capacity, in gallons. a.
> Assume that σ = 2.4. a. Obtain a 95% confidence interval for the mean number of young per litter of all female eastern cottonmouths. b. Interpret your result in part (a). c. Does the mean number of young per litter of all female eastern cottonmouths lie
> What is a confidence-interval estimate of a parameter? Why is such an estimate superior to a point estimate?
> Assume that recent wedding costs in the United States are normally distributed with a standard deviation of $8100. a. Determine a 95% confidence interval for the mean cost, μ, of all recent U.S. weddings. b. Interpret your result in part (a). c. Does the
> In the article “The Eastern Cottonmouth (Agkistrodon piscivorus) at the Northern Edge of Its Range” (Journal of Herpetology, Vol. 29, No. 3, pp. 391–398), C. Blem and L. Blem examined the reproductive characteristics of the eastern cottonmouth, a once wi
> Construct a relative frequency polygon for the energy-consumption data given in Exercise 2.84. Use the classes specified in that exercise. Data from Exercise 2.84: Use the specified grouping method to a. determine a frequency distribution. b. obtain a r
> According to Bride’s Magazine, getting married these days can be expensive when the costs of the reception, engagement ring, bridal gown, pictures—just to name a few—are included. A simple random sample of 20 recent U.S. weddings yielded the following da
> x¯ = 55, n = 16, σ = 5 a. Find a 95% confidence interval for the population mean. b. Identify and interpret the margin of error. c. Express the endpoints of the confidence interval in terms of the point estimate and the margin of error.
> With the advent of highspeed computing, new procedures have been developed that permit statistical inferences to be performed under less restrictive conditions than those of classical procedures. Bootstrap confidence intervals constitute one such collect
> Examine one-sided confidence intervals. In a national poll of 1039 U.S. adults, conducted November 7–10, 2013, Gallup asked “Roughly how much money do you think you personally will spend on Christmas gifts this year?”. The data provided on the WeissStat
> x¯ = 50, n = 16, σ = 5 a. Find a 95% confidence interval for the population mean. b. Identify and interpret the margin of error. c. Express the endpoints of the confidence interval in terms of the point estimate and the margin of error.
> Examine one-sided confidence intervals. In the article “Sweetening Statistics—What M&M’s Can Teach Us” (Minitab Inc., August 2008), M. Paret and E. Martz discussed several statistical analyses that they performed on bags of M&Ms. The authors took a rando
> Examine one-sided confidence intervals. Refer to Exercise 8.130. a. Find and interpret a 90% lower confidence bound for last year’s mean time spent per day with digital media by American adults. b. Compare your one-sided confidence interval in part (a) t
> Examine one-sided confidence intervals. Refer to Exercise 8.129. a. Determine and interpret a 90% upper confidence bound for the mean commute time of all commuters in Washington, DC. b. Compare your one-sided confidence interval in part (a) to the (two s
> Examine one-sided confidence intervals. Presuming that the assumptions for a one-mean t-interval are satisfied, we have the following formulas for (1 − α)-level confidence bounds for a population mean μ: - Lower confidence bound: x¯ − tα · s/ √n - Upper
> An issue of Scientific American revealed that the batting averages of major-league baseball players are normally distributed with mean .270 and standard deviation .031. a. Simulate 2000 samples of five batting averages each. b. Determine the sample mean
> The following bivariate data on age (in years) and gender were obtained from the students in a freshman calculus course. The data show, for example, that the first student on the list is 21 years old and is a male. a. Group these data in the following co
> Let 0
> Appendix A contains degrees of freedom from 1 to 75 consecutively but then contains only selected degrees of freedom. a. Why couldn’t we provide entries for all possible degrees of freedom? b. Why did we construct the table so that consecutive entries ap
> A city planner working on bikeways designs a questionnaire to obtain information about local bicycle commuters. One of the questions asks how long it takes the rider to pedal from home to his or her destination. A sample of local bicycle commuters yields
> Numerous studies have shown that high blood cholesterol leads to artery clogging and subsequent heart disease. One such study by D. Scott et al. was published in the paper “Plasma Lipids as Collateral Risk Factors in Coronary Artery Disease: A Study of 3
> In 1903, K. Pearson and A. Lee published the paper “On the Laws of Inheritance in Man. I. Inheritance of Physical Characters” (Biometrika, Vol. 2, pp. 357–462). The article examined and presented data on forearm length, in inches, for a sample of 140 men
> x¯ = 35, n = 25, σ = 4 a. Find a 95% confidence interval for the population mean. b. Identify and interpret the margin of error. c. Express the endpoints of the confidence interval in terms of the point estimate and the margin of error.
> The subterranean coruro (Spalacopus cyanus) is a social rodent that lives in large colonies in underground burrows that can reach lengths of up to 600 meters. Zoologists S. Begall and M. Gallardo studied the characteristics of the burrow systems of the s
> In the special report “Mousetrap: The Most-Visited Shoe and Apparel E-tailers” (Footwear News, Vol. 58, No. 3, p. 18), we found the following data on the average time, in minutes, spent per user per month from January to June of one year for a sample of
> In the article “The $350,000 Club” (The Business Journal, Vol. 24, Issue 14, pp. 80–82), J. Trunelle et al. examined Arizona public-company executives with salaries and bonuses totaling over $350,000. The following data provide the salaries, to the neare
> R. Nielsen et al. compared 13,731 annotated genes from humans with their chimpanzee orthologs to identify genes that show evidence of positive selection. The researchers published their findings in “A Scan for Positively Selected Genes in the Genomes of
> Refer to the weight data. Note that there are 37 observations, the smallest and largest of which are 129.2 and 278.8, respectively. Apply the preceding procedure to choose classes for cutpoint grouping. Use approximately eight classes. Note: If in Step 2
> The annual update of U.S. Overseas Loans and Grants, informally known as the “Greenbook,” contains data on U.S. government monetary economic and military assistance loans. The following table shows military assistance loans, in thousands of dollars, to a
> The webpage “Bottlenose Dolphin” produced by the National Geographic Society provides information about the bottlenose dolphin. A random sample of 50 adult bottlenose dolphins have a mean length of 12.04 ft with a standard deviation of 1.03 ft. Find and
> As reported by B. Warner and J. Rutledge in the paper “Checking the Chips Ahoy! Guarantee” (Chance, Vol. 12, Issue 1, pp. 10–14), a random sample of forty-two 18-ounce bags of Chips Ahoy! cookies yielded a mean of 1261.6 chips per bag with a standard dev
> Taking the family to an amusement park has become increasingly costly according to the industry publication Amusement Business, which provides figures on the cost for a family of four to spend the day at one of America’s amusement parks. A random sample
> In 1908, W. S. Gosset published the article “The Probable Error of a Mean” (Biometrika, Vol. 6, pp. 1–25). In this pioneering paper, written under the pseudonym “Student,” Gosset introduced what later became known as Student’s t-distribution. Gosset used
> According to eMarketer, the average time spent per day with digital media in 2010 was 3 hours and 14 minutes. For last year, a random sample of 20 American adults spent the following number of hours per day with digital media. Find and interpret a 90% co
> x¯ = 30, n = 25, σ = 4 a. Find a 95% confidence interval for the population mean. b. Identify and interpret the margin of error. c. Express the endpoints of the confidence interval in terms of the point estimate and the margin of error.
> x¯ = 55, n = 16, s = 5, confidence level = 99% a. use the one-mean t-interval procedure to find a confidence interval for the mean of the population from which the sample was drawn. b. obtain the margin of error by taking half the length of the confidenc
> x¯ = 50, n = 16, s = 5, confidence level = 99% a. use the one-mean t-interval procedure to find a confidence interval for the mean of the population from which the sample was drawn. b. obtain the margin of error by taking half the length of the confidenc
> Refer to the days-to-maturity data. Note that there are 40 observations, the smallest and largest of which are 36 and 99, respectively. Apply the preceding procedure to choose classes for limit grouping. Use approximately seven classes. Note: If in Step
> As you learned at the beginning of this chapter, Z. Veselska et al. explored connections between aspects of self-perception and physical activity among adolescents. The study involved a sample of adolescents from the Slovak and Czech Republics with ages
> x¯ = 35, n = 25, s = 4, confidence level = 90% a. use the one-mean t-interval procedure to find a confidence interval for the mean of the population from which the sample was drawn. b. obtain the margin of error by taking half the length of the confidenc
> x¯ = 30, n = 25, s = 4, confidence level = 90% a. use the one-mean t-interval procedure to find a confidence interval for the mean of the population from which the sample was drawn. b. obtain the margin of error by taking half the length of the confidenc
> x¯ = 25, n = 36, s = 3, confidence level = 95% a. use the one-mean t-interval procedure to find a confidence interval for the mean of the population from which the sample was drawn. b. obtain the margin of error by taking half the length of the confidenc
> x¯ = 20, n = 36, s = 3, confidence level = 95% a. use the one-mean t-interval procedure to find a confidence interval for the mean of the population from which the sample was drawn. b. obtain the margin of error by taking half the length of the confidenc
> For the one-mean t-interval procedure, express the formula for the endpoints of a confidence interval in the form point estimate ± margin of error.
> Identify the formula for the margin of error for the estimate of a population mean when the population standard deviation is unknown.
> A simple random sample of size 17 is taken from a population with unknown standard deviation. A normal probability plot of the data reveals an outlier but is otherwise roughly linear. Can you reasonably apply the t-interval procedure? Explain your answer
> x¯ = 25, n = 36, σ = 3 a. Find a 95% confidence interval for the population mean. b. Identify and interpret the margin of error. c. Express the endpoints of the confidence interval in terms of the point estimate and the margin of error.
> A simple random sample of size 100 is taken from a population with unknown standard deviation. A normal probability plot of the data displays significant curvature but no outliers. Can you reasonably apply the t-interval procedure? Explain your answer.
> For a t-curve with df = 8, find each t-value, and illustrate your results graphically. a. The t-value having area 0.05 to its right b. t0.10 c. The t-value having area 0.01 to its left d. The two t-values that divide the area under the curve into a middl
> The exam scores for the students in an introductory statistics class are as follows. a. Group these exam scores, using the classes 30–39, 40–49, 50–59, 60–69, 70–79, 80–89, and 90–100. b. What are the widths of the classes? c. If you wanted all the class
> For a t-curve with df = 21, find each t-value, and illustrate your results graphically. a. The t-value having area 0.10 to its right b. t0.01 c. The t-value having area 0.025 to its left d. The two t-values that divide the area under the curve into a mid
> For a t-curve with df = 17, use Table IV to find each t-value. a. t0.05 b. t0.025 c. t0.005
> For a t-curve with df = 6, use Table IV to find each t-value. a. t0.10 b. t0.025 c. t0.01
> Two t-curves have degrees of freedom 12 and 20, respectively. Which one more closely resembles the standard normal curve? Explain your answer.
> Explain why there is more variation in the possible values of the studentized version of x¯ than in the possible values of the standardized version of x¯.
> An issue of Scientific American revealed that batting averages, x, of major-league baseball players are normally distributed and have a mean of 0.270 and a standard deviation of 0.031. For samples of 20 batting averages, identify the distribution of each
> From the paper “Effects of Chronic Nitrate Exposure on Gonad Growth in Green Sea Urchin Strongylocentrotus droebachiensis” (Aquaculture, Vol. 242, No. 1–4, pp. 357–363) by S. Siikavuopio et al., the weights, x, of adult green sea urchins are normally dis
> A variable of a population has a normal distribution. Suppose that you want to find a confidence interval for the population mean. a. If you know the population standard deviation, which procedure would you use? b. If you do not know the population stan
> x¯ = 20, n = 36, σ = 3 a. Find a 95% confidence interval for the population mean. b. Identify and interpret the margin of error. c. Express the endpoints of the confidence interval in terms of the point estimate and the margin of error.
> A variable has a mean of 100 and a standard deviation of 16. Four observations of this variable have a mean of 108 and a sample standard deviation of 12. Determine the observed value of the a. standardized version of x¯. b. studentized version of x¯.
> A study by researchers at the University of Maryland addressed the question of whether the mean body temperature of humans is 98.6◦F. The results of the study by P. Mackowiak et al. appeared in the article “A Critical Appraisal of 98.6◦F, the Upper Limit
> Why do you need to consider the studentized version of x¯ to develop a confidence-interval procedure for a population mean when the population standard deviation is unknown?
> Refer to Exercise 8.71. a. Determine and interpret a 99% lower confidence bound for the mean cadmium level of all Boletus pinicola mushrooms. b. Compare your one-sided confidence interval in part (a) to the (two sided) confidence interval found in Exerci
> Refer to Exercise 8.70. a. Determine and interpret a 95% upper confidence bound for the mean calcium intake of all people with incomes below the poverty level. b. Compare your one-sided confidence interval in part (a) to the (two-sided) confidence interv
> Presuming that the assumptions for a one-mean z-interval are satisfied, we have the following formulas for (1 − α) level confidence bounds for a population mean μ: - Lower confidence bound x¯ − zα · σ/√n - Upper confidence bound x¯ + zα · σ/√n Interpret
> For a fixed confidence level, show that (approximately) quadrupling the sample size is necessary to halve the margin of error.
> Suppose that a simple random sample is taken from a normal population having a standard deviation of 10 for the purpose of obtaining a 95% confidence interval for the mean of the population. a. If the sample size is 4, obtain the margin of error. b. Repe
> This exercise can be done individually or, better yet, as a class project. Gestation periods of humans are normally distributed with a mean of 266 days and a standard deviation of 16 days. a. Simulate 100 samples of nine human gestation periods each. b.
> The cheetah (Acinonyx jubatus) is the fastest land mammal and is highly specialized to run down prey. The cheetah often exceeds speeds of 60 mph and, according to the online document “Cheetah Conservation in Southern Africa” (Trade & Environment Database
> R. Reifen et al. studied various nutritional measures of Ethiopian school children and published their findings in the paper “Ethiopian-Born and Native Israeli School Children Have Different Growth Patterns” (Nutrition, Vol. 19, pp. 427–431). The study,
> Refer to Exercise 8.8 and find a point estimate for the population standard deviation (i.e., the standard deviation of the variable). Data from Exercise 8.8: A simple random sample is taken from a population and yields the following data for a variable
> As reported by the U.S. Census Bureau in Educational Attainment in the United States, the percentage of adults in each state and the District of Columbia who have completed a bachelor’s degree is provided on the WeissStats site. Apply the technology of y
> The value of a statistic used to estimate a parameter is called a ____ of the parameter.
> We have given population data for a variable. For each exercise, do the following tasks. a. Find the mean, μ, of the variable. b. For each of the possible sample sizes, construct a table and draw a dotplot for the sampling distribution of the sample mean
> A variable is said to have an exponential distribution or to be exponentially distributed if its distribution has the shape of an exponential curve, that is, a curve of the form y = e−x/μ/μ for x > 0, where μ is the mean of the variable. The standard dev
> For humans, gestation periods are normally distributed with a mean of 266 days and a standard deviation of 16 days. a. Use the technology of your choice to simulate 2000 samples of nine human gestation periods each. b. Find the sample mean of each of the
> We conducted a simulation to check the plausibility of the central limit theorem. The variable under consideration there is household size, and the population consists of all U.S. households. A frequency distribution for household size of U.S. households
> A brand of water-softener salt comes in packages marked “net weight 40 lb.” The company that packages the salt claims that the bags contain an average of 40 lb of salt and that the standard deviation of the weights is 1.5 lb. Assume that the weights are
> We have given population data for a variable. For each exercise, do the following tasks. a. Find the mean, μ, of the variable. b. For each of the possible sample sizes, construct a table and draw a dotplot for the sampling distribution of the sample mean
> A variable of a population has mean μ and standard deviation σ. For a large sample size n, fill in the blanks. Justify your answers. a. Approximately % of all possible samples have means within σ/√n of the population mean, μ. b. Approximately % of all po
> A variable of a population is normally distributed with mean μ and standard deviation σ. For samples of size n, fill in the blanks. Justify your answers. a. Approximately 68% of all possible samples have means that lie within of the population mean, μ. b
> A study by M. Chen et al. titled “Heat Stress Evaluation and Worker Fatigue in a Steel Plant” (American Industrial Hygiene Association, Vol. 64, pp. 352–359) assessed fatigue in steel plant workers due to heat stress. If the mean post-work heart rate for
> As reported by the U.S. Census Bureau in Educational Attainment in the United States, the percentage of adults in each state and the District of Columbia who have completed high school is provided on the WeissStats site. Apply the technology of your choi
> Dementia is the loss of the intellectual and social abilities severe enough to interfere with judgment, behavior, and daily functioning. Alzheimer’s disease is the most common type of dementia. In the article “Living with Early Onset Dementia: Exploring
> Calcium is the most abundant mineral in the human body and has several important functions. Recommendations for calcium are provided in Dietary Reference Intakes, developed by the Institute of Medicine of the National Academy of Sciences. The recommended
> In the document Anthropometric Reference Data for Children and Adults, C. Fryer et al. present data from the National Health and Nutrition Examination Survey on a variety of human body measurements. A half-century ago, the mean height of (U.S.) women in

