Question: Answer the questions about the specified normal
Answer the questions about the specified normal distribution.
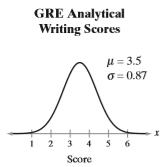
The test scores for the analytical writing section of the Graduate Record Examination (GRE) can be approximated by a normal distribution, as shown in the figure.
a. What is the maximum score that can be in the bottom 10% of scores?
b. Between what two values does the middle 80% of the scores lie?
Transcribed Image Text:
GRE Analytical Writing Scores A = 3.5 O = 0.87 1 2 4 5 6 Score
> The weights of ice cream cartons are normally distributed with a mean weight of 10 ounces and a standard deviation of 0.5 ounce. a. What is the probability that a randomly selected carton has a weight greater than 10.21 ounces? b. You randomly select 2
> The lengths of lumber a machine cuts are normally distributed, with a mean of 96 inches and a standard deviation of 0.5 inch. a. What is the probability that a randomly selected board cut by the machine has a length greater than 96.25 inches? b. You ra
> Determine whether the random variable x is discrete or continuous. Explain. Let x represent the number of pumps in use at a gas station.
> A machine is set to fill milk containers with a mean of 64 ounces and a standard deviation of 0.11 ounce. A random sample of 40 containers has a mean of 64.05 ounces. The machine needs to be reset when the mean of a random sample is unusual. Does the mac
> A machine is set to fill paint cans with a mean of 128 ounces and a standard deviation of 0.2 ounce. A random sample of 40 cans has a mean of 127.9 ounces. The machine needs to be reset when the mean of a random sample is unusual. Does the machine need t
> Assume that the carbon dioxide emissions in Exercise 32 are normally distributed. Are you more likely to randomly select 1 country with carbon dioxide emissions less than 30 metric tons or to randomly select a sample of 15 countries with mean carbon diox
> Assume that the childhood asthma prevalences in Exercise 31 are normally distributed. Are you more likely to randomly select 1 city with childhood asthma prevalence less than 3.2% or to randomly select a sample of 10 cities with a mean childhood asthma p
> Find the indicated probability and interpret the results. The mean per capita carbon dioxide emissions in 58 industrialized countries over a 22-year period is 25.5 metric tons. A random sample of 44 countries is selected. What is the probability that the
> Find the indicated probability and interpret the results. From 1871 through 2016, the mean return of the Standard & Poor’s 500 was 10.72%. A random sample of 38 years is selected from this population. What is the probability that the mean return for the
> Find the indicated probability and interpret the results. From 1871 through 2016, the mean return of the Standard & Poor’s 500 was 10.72%. A random sample of 38 years is selected from this population. What is the probability that the mean return for the
> A population has a mean µ and a standard deviation σ. Find the mean and standard deviation of the sampling distribution of sample means with sample size n. µ = 790, σ = 48, n = 250
> Find the indicated probability and interpret the results. From 1975 through 2016, the mean gain of the Dow Jones Industrial Average was 456. A random sample of 32 years is selected from this population. What is the probability that the mean gain for the
> Repeat Exercise 20 for samples of size 72 and 108. What happens to the mean and the standard deviation of the distribution of sample means as the sample size increases?
> Find the indicated probabilities using the geometric distribution, the Poisson distribution, or the binomial distribution. Then determine whether the events are unusual. If convenient, use a table or technology to find the probabilities. Eighty-two perce
> Repeat Exercise 19 for samples of size 40 and 60. What happens to the mean and the standard deviation of the distribution of sample means as the sample size increases?
> Find the mean and standard deviation of the indicated sampling distribution of sample means. Then sketch a graph of the sampling distribution. The annual salary for clinical pharmacists is normally distributed, with a mean of about $111,000 and a standar
> Find the mean and standard deviation of the indicated sampling distribution of sample means. Then sketch a graph of the sampling distribution. The annual salary for senior-level chemical engineers is normally distributed, with a mean of about $132,000 an
> Find the mean and standard deviation of the indicated sampling distribution of sample means. Then sketch a graph of the sampling distribution. The amounts of cold water for patient consumption in hospitals in Spain are normally distributed, with a mean o
> Find the mean and standard deviation of the indicated sampling distribution of sample means. Then sketch a graph of the sampling distribution. A water footprint is a measure of the appropriation of fresh water. The per capita water footprint in the Unite
> Find the mean and standard deviation of the indicated sampling distribution of sample means. Then sketch a graph of the sampling distribution. The monthly growing season precipitation across villages in Tanzania is normally distributed, with a mean of 87
> Find the mean and standard deviation of the indicated sampling distribution of sample means. Then sketch a graph of the sampling distribution. The monthly growing season temperatures across villages in Tanzania are normally distributed, with a mean of 23
> Find the mean and standard deviation of the indicated sampling distribution of sample means. Then sketch a graph of the sampling distribution. The scores for females on the critical reading portion of the SAT in 2016 are normally distributed, with a mean
> A population has a mean µ and a standard deviation σ. Find the mean and standard deviation of the sampling distribution of sample means with sample size n. µ = 45, σ = 15, n = 100
> Find the mean and standard deviation of the indicated sampling distribution of sample means. Then sketch a graph of the sampling distribution. The scores for males on the critical reading portion of the SAT in 2016 are normally distributed, with a mean o
> Find the indicated probabilities using the geometric distribution, the Poisson distribution, or the binomial distribution. Then determine whether the events are unusual. If convenient, use a table or technology to find the probabilities. During a 10-year
> The population mean and standard deviation are given. Find the indicated probability and determine whether the given sample mean would be considered unusual. For a random sample of n = 36, find the probability of a sample mean being less than 12,750 or g
> The population mean and standard deviation are given. Find the indicated probability and determine whether the given sample mean would be considered unusual. For a random sample of n = 45, find the probability of a sample mean being greater than 551 when
> The population mean and standard deviation are given. Find the indicated probability and determine whether the given sample mean would be considered unusual. For a random sample of n = 100, find the probability of a sample mean being greater than 24.3 wh
> The population mean and standard deviation are given. Find the indicated probability and determine whether the given sample mean would be considered unusual. For a random sample of n = 64, find the probability of a sample mean being less than 24.3 when µ
> A population and sample size are given. a. Find the mean and standard deviation of the population. b. List all samples (with replacement) of the given size from the population and find the mean of each. c. Find the mean and standard deviation of the s
> A population and sample size are given. a. Find the mean and standard deviation of the population. b. List all samples (with replacement) of the given size from the population and find the mean of each. c. Find the mean and standard deviation of the s
> A population and sample size are given. a. Find the mean and standard deviation of the population. b. List all samples (with replacement) of the given size from the population and find the mean of each. c. Find the mean and standard deviation of the s
> A population and sample size are given. a. Find the mean and standard deviation of the population. b. List all samples (with replacement) of the given size from the population and find the mean of each. c. Find the mean and standard deviation of the s
> The graph of a population distribution is shown with its mean and standard deviation. Random samples of size 100 are drawn from the population. Determine which of the figures labeled (a)–(c) would most closely resemble the sampling dist
> A population has a mean µ and a standard deviation σ. Find the mean and standard deviation of the sampling distribution of sample means with sample size n. µ = 150, σ = 25, n = 50
> Find the indicated probabilities using the geometric distribution, the Poisson distribution, or the binomial distribution. Then determine whether the events are unusual. If convenient, use a table or technology to find the probabilities. In a recent seas
> Use the Standard Normal Table or technology to find the z-score that corresponds to the cumulative area or percentile. P15
> Use the Standard Normal Table or technology to find the z-score that corresponds to the cumulative area or percentile. 0.0046
> Use the Standard Normal Table or technology to find the z-score that corresponds to the cumulative area or percentile. 0.94
> Use the Standard Normal Table or technology to find the z-score that corresponds to the cumulative area or percentile. 0.85
> Use the Standard Normal Table or technology to find the z-score that corresponds to the cumulative area or percentile. 0.05
> In a large section of a history class, the points for the final exam are normally distributed, with a mean of 72 and a standard deviation of 9. Grades are assigned according to the rule below. • The top 10% receive an A. â€
> A vending machine dispenses coffee into an eight-ounce cup. The amounts of coffee dispensed into the cup are normally distributed, with a standard deviation of 0.03 ounce. You can allow the cup to overflow 1% of the time. What amount should you set as th
> You sell a brand of automobile tire that has a life expectancy that is normally distributed, with a mean life of 30,000 miles and a standard deviation of 2500 miles. You want to give a guarantee for free replacement of tires that do not wear well. You ar
> Use the Standard Normal Table or technology to find the z-score that corresponds to the cumulative area or percentile. 0.7995
> The weights of bags of baby carrots are normally distributed, with a mean of 32 ounces and a standard deviation of 0.36 ounce. Bags in the upper 4.5% are too heavy and must be repackaged. What is the most a bag of baby carrots can weigh and not need to b
> Find the indicated probabilities using the geometric distribution, the Poisson distribution, or the binomial distribution. Then determine whether the events are unusual. If convenient, use a table or technology to find the probabilities. Thirty-six perce
> Answer the questions about the specified normal distribution. The pregnancy length (in days) for a population of new mothers can be approximated by a normal distribution, with a mean of 267 days and a standard deviation of 10 days. a. What is the minimu
> Answer the questions about the specified normal distribution. The red blood cell counts (in millions of cells per microliter) for a population of adult males can be approximated by a normal distribution, with a mean of 5.4 million cells per microliter an
> Answer the questions about the specified normal distribution. The undergraduate grade point averages (UGPA) of students taking the Law School Admission Test in a recent year can be approximated by a normal distribution, as shown in the figure. a. What i
> Answer the questions about the specified normal distribution. A water footprint is a measure of the appropriation of fresh water. The per capita water footprint (in mega gallons) in the U.S. for a recent year can be approximated by a normal distribution,
> Answer the questions about the specified normal distribution. The per capita energy consumption level (in kilowatt-hours) in Venezuela for a recent year can be approximated by a normal distribution, as shown in the figure. a. What consumption level repr
> Answer the questions about the specified normal distribution. In a recent study on world happiness, participants were asked to evaluate their current lives on a scale from 0 to 10, where 0 represents the worst possible life and 10 represents the best pos
> Answer the questions about the specified normal distribution. In a survey of women in the United States (ages 20 –29), the mean height was 64.2 inches with a standard deviation of 2.9 inches. a. What height represents the 95th percentile? b. What heigh
> Find the indicated z-score. Find the positive z-score for which 12% of the distribution’s area lies between -z and z.
> Use the Standard Normal Table or technology to find the z-score that corresponds to the cumulative area or percentile. 0.6736
> Find the indicated probabilities using the geometric distribution, the Poisson distribution, or the binomial distribution. Then determine whether the events are unusual. If convenient, use a table or technology to find the probabilities. During a 77-year
> Find the indicated z-score. Find the positive z-score for which 80% of the distribution’s area lies between -z and z.
> Find the indicated z-score. Find the z-score that has 84.1345% of the distribution’s area to its right.
> Find the indicated z-score. Find the z-score that has 2.275% of the distribution’s area to its left.
> Find the indicated z-score. Find the z-score that has 20.9% of the distribution’s area to its right.
> Find the indicated z-score. Find the z-score that has 63.7% of the distribution’s area to its right.
> Find the indicated z-score. Find the z-score that has 78.5% of the distribution’s area to its left.
> Find the indicated z-score. Find the z-score that has 11.9% of the distribution’s area to its left.
> Find the indicated z-score(s) shown in the graph. Area = Area = 0.05 0.05 z= ? z=?
> Find the indicated z-score(s) shown in the graph. Area = 0.475 Area = 0.475 Z= ?
> Find the indicated z-score(s) shown in the graph. Area = 0.7190
> Find the indicated probabilities using the geometric distribution, the Poisson distribution, or the binomial distribution. Then determine whether the events are unusual. If convenient, use a table or technology to find the probabilities. Eighty-two perce
> Use the Standard Normal Table or technology to find the z-score that corresponds to the cumulative area or percentile. 0.4364
> Find the indicated z-score(s) shown in the graph. Area = 0.0233 z=?
> Find the indicated z-score(s) shown in the graph. Area = 0.5987
> Find the indicated z-score(s) shown in the graph. Area = 0.3520 2- z- 0
> Use the Standard Normal Table or technology to find the z-score that corresponds to the cumulative area or percentile. P75
> Use the Standard Normal Table or technology to find the z-score that corresponds to the cumulative area or percentile. P91
> Use the Standard Normal Table or technology to find the z-score that corresponds to the cumulative area or percentile. P40
> Use the Standard Normal Table or technology to find the z-score that corresponds to the cumulative area or percentile. P25
> Use the Standard Normal Table or technology to find the z-score that corresponds to the cumulative area or percentile. P67
> Use the Standard Normal Table or technology to find the z-score that corresponds to the cumulative area or percentile. P88
> Find the mean, variance, and standard deviation of the binomial distribution for the given random variable. Interpret the results. Fifty-six percent of college student-athletes receive athletics scholarships. You randomly select five college student-athl
> The table lists the number of wireless devices per household in a small town in the United States. a. Construct a probability distribution. b. Graph the probability distribution using a histogram and describe its shape. c. Find the mean, variance, and
> Use the Standard Normal Table or technology to find the z-score that corresponds to the cumulative area or percentile. P30
> Use the Standard Normal Table or technology to find the z-score that corresponds to the cumulative area or percentile. 0.2090
> Find the indicated probabilities. If convenient, use technology to find the probabilities. In a recent year, the MCAT total scores were normally distributed, with a mean of 500 and a standard deviation of 10.6. Find the probability that a randomly select
> Find the indicated probabilities. If convenient, use technology to find the probabilities. In a survey of U.S. women, the heights in the 20- to 29-year age group were normally distributed, with a mean of 64.2 inches and a standard deviation of 2.9 inches
> Find the indicated probabilities. If convenient, use technology to find the probabilities. In a recent study on world happiness, participants were asked to evaluate their current lives on a scale from 0 to 10, where 0 represents the worst possible life a
> The random variable x is normally distributed with mean µ = 174 and standard deviation σ = 20. Find the indicated probability. P(172 < x < 192)
> The random variable x is normally distributed with mean µ = 174 and standard deviation σ = 20. Find the indicated probability. P(160 < x < 170)
> From a pool of 16 candidates, 9 men and 7 women, the offices of president, vice president, secretary, and treasurer will be filled. a. In how many different ways can the offices be filled? b. What is the probability that all four of the offices are fil
> Use the probability distribution in Exercise 3 to find the probability of randomly selecting a game in which Garrett Temple had a. fewer than four personal fouls, b. at least three personal fouls, and c. between two and four personal fouls, inclusive.
> Find the a. mean, b. variance, c. standard deviation, and d. expected value of the probability distribution. Interpret the results. The table shows the distribution of personal fouls per game for Garrett Temple in a recent NBA season. 1 2 3 4 5
> Find the mean, variance, and standard deviation of the binomial distribution for the given random variable. Interpret the results. About 13% of U.S. drivers are uninsured. You randomly select eight U.S. drivers and ask them whether they are uninsured. Th
> Find the a. mean, b. variance, c. standard deviation, and d. expected value of the probability distribution. Interpret the results. The table shows the distribution of household sizes in the United States for a recent year. 1 2. 3 4 5 6 7 P(x) 0
> A survey of adults in the United States found that 61% ate at a restaurant at least once in the past week. You randomly select 30 adults and ask them whether they ate at a restaurant at least once in the past week. a. Verify that a normal distribution c
> Seventy percent of U.S. adults anticipate major cyberattacks on public infrastructure in the next five years. You randomly select 10 U.S. adults. a. Construct a binomial distribution for the random variable x, the number of U.S. adults who anticipate ma
> A florist has 12 different flowers from which floral arrangements can be made. A centerpiece is made using four different flowers. a. How many different centerpieces can be made? b. What is the probability that the four flowers in the centerpiece are r
> The life spans of car batteries are normally distributed, with a mean of 44 months and a standard deviation of 5 months. a. Find the probability that the life span of a randomly selected battery is less than 36 months. b. Find the probability that the
> The initial pressures for bicycle tires when first filled are normally distributed, with a mean of 70 pounds per square inch (psi) and a standard deviation of 1.2 psi. a. Random samples of size 40 are drawn from this population, and the mean of each sam
> The table shows the results of a survey in which 3,405,100 public and 489,900 private school teachers were asked about their full-time teaching experience. a. Find the probability that a randomly selected private school teacher has 10 to 20 years of ful
> An auto parts seller finds that 1 in every 200 parts sold is defective. Use the geometric distribution to find the probability that a. the first defective part is the fifth part sold, b. the first defective part is the first, second, or third part sold
> Twenty-eight percent of U.S. adults think that climate scientists understand the causes of climate change very well. You randomly select 25 U.S. adults. Find the probability that the number of U.S. adults who think that climate scientists understand the

