Question: Between 1995 and 2000, the U.S.
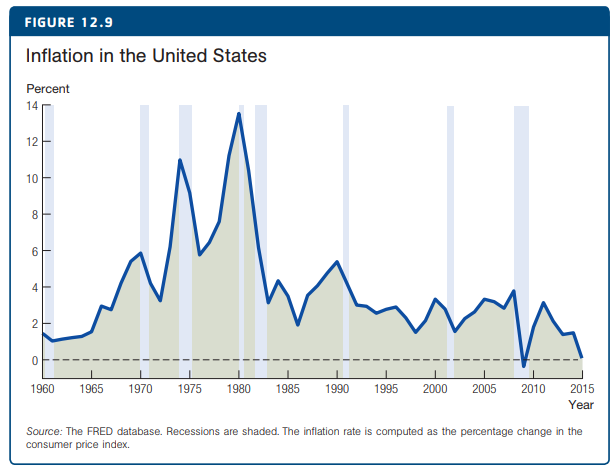
Between 1995 and 2000, the U.S. economy experienced surprisingly rapid growth, termed the “new economy†by some observers. Was this a change in potential output or short- run output? Alan Greenspan, Fed chairman, argued it was a change in potential and did not raise interest rates to slow the economy. At the time, many economists thought this was a mistake. Look back at the data on inflation in Figure 12.9 to form your own opinion. Write a brief memo (one page or less) either defending or criticizing Greenspan’s position. Be sure to use the graphs of the short- run model to make your case.
Figure 12.9:
Transcribed Image Text:
FIGURE 12.9 Inflation in the United States Percent 14 12 10 8. 1960 1965 1970 1975 1980 1985 1990 1995 2000 2005 2010 2015 Year Source: The FRED database. Recessions are shaded. The inflation rate is computed as the percentage change in the consumer price index. 2.
> Sink Corporation prepared the following summarized balance sheet on January 1, 20X1: Plumber Company acquires 80 percent of Sink Corporation’s common stock on January 1, 20X1, for $80,000. At that date, the fair value of the common sh
> Refer to the information presented in P12-17 and your answer to part a of P12-17. Required: Prepare a schedule providing a proof of the translation adjustment. Data from P12-17: On January 1, 20X5, Pirate Company acquired all of the outstanding stock
> Refer to the information in P12-17. Assume the U.S. dollar is the functional currency, not the krone. Required: a. Prepare a schedule re measuring the trial balance from Norwegian kroner into U.S. dollars. b. Assume that Pirate uses the fully adjusted e
> On January 1, 20X5, Pirate Company acquired all of the outstanding stock of Ship Inc., a Norwegian company, at a cost of $151,200. Ship’s net assets on the date of acquisition were 700,000 kroner (NKr). On January 1, 20X5, the book and
> Match the items in the left-hand column with the descriptions/explanations in the right-hand column. Items Descriptions/Explanations A. Hedge of the exposure to changes in the fair value of a recognized asset or liability or an unrecognized firm com
> On November 3, 20X2, PRD Corporation acquired 2 JRS Company bonds ($1,000 face value) at a cost of 105. PRD classifies them as available-for-sale securities. On this same date, PRD decides to hedge against a possible decline in the value of the securitie
> Mega Company believes the price of oil will increase in the coming months. Therefore, it decides to purchase call options on oil as a price risk-hedging device to hedge the expected increase in prices on an anticipated purchase of oil. On November 30, 20
> Select the correct answer for each of the following questions. 1. According to ASC 815, which of the following is not an underlying? a. A security price. b. A monthly average temperature. c. The price of a barrel of oil. d. The number of foreign currenc
> On December 1, 20X1, Micro World Inc. entered into a 120-day forward contract to sell 100,000 Australian dollars (A$). Micro World’s fiscal year ends on December 31. The direct exchange rates follow: Required: Prepare all journal entr
> Match the items in the left-hand column with the descriptions/explanations in the right-hand column. Items Descriptions/Explanations A. Exchange rate for immediate delivery of currencies. B. Imports and exports whose prices are stated in a foreign c
> Maple Company had the following export and import transactions during 20X5: 1. On March 1, Maple sold goods to a Canadian company for C$30,000, receivable on May 30. The spot rates for Canadian dollars were C$1 = $0.65 on March 1 and C$1 = $0.68 on May 3
> Select the correct completion of each of the following items. 1. Which of the following steps in the acquisition of goods and services occurs first? a. Appropriation b. Encumbrance c. Budget d. Expenditure 2. What account is used to earmark the fund ba
> Globe Shipping, a U.S. company, is an importer and exporter. The following are some transactions with foreign companies. 1. Globe sold blue jeans to a South Korean importer on January 15 for $7,400, when the exchange rate was South Korean won (KRW)1 = $0
> Tex Hardware sells many of its products overseas. The following are some selected transactions. 1. Tex sold electronic subassemblies to a firm in Denmark for 120,000 Danish kroner (Dkr) on June 6, when the exchange rate was Dkr 1 = $0.1750. Collection wa
> Princeton Products Corporation acquired 90 percent ownership of Stanford Company on October 20, 20X2, through an exchange of voting shares. Princeton Products issued 8,000 shares of its $10 par stock to acquire 27,000 shares of Stanford’
> Stage Company operates on a calendar-year basis, reporting its results of operations quarterly. For the first quarter of 20X1, Stage reported sales of $240,000 and operating expenses of $180,000 and paid dividends of $10,000. On April 1, 20X1, Parachute
> Protecto Corporation purchased 60 percent of Strand Company’s outstanding shares on January 1, 20X1, for $24,000 more than book value. At that date, the fair value of the noncontrolling interest was $16,000 more than 40 percent of Stran
> Following are the consolidated balance sheet accounts of Primer Inc. and its subsidiary, Sore Corporation, as of December 31, 20X6 and 20X5. Additional Information: 1. On January 20, 20X6, Primer issued 10,000 shares of its common stock for land having
> Using the data presented in P10-20: a. Prepare a worksheet to develop a consolidated statement of cash flows for 20X4 using the direct method of computing cash flows from operations. b. Prepare a consolidated statement of cash flows for 20X4. Data from
> Point Company holds 80 percent ownership of Shoot Company. The consolidated balance sheets as of December 31, 20X3, and December 31, 20X4, are as follows: The 20X4 consolidated income statement contained the following amounts: Point acquired its inve
> Using the data presented in P10-18: a. Prepare a worksheet to develop a consolidated statement of cash flows for 20X3 using the direct method of computing cash flows from operations. b. Prepare a consolidated statement of cash flows for 20X3. Data from
> Pear Corporation acquired 75 percent ownership of Sugar Company on January 1, 20X1, at underlying book value. At that date, the fair value of the non controlling interest was equal to 25 percent of the book value of Sugar Company. Consolidated balance sh
> Select the correct response for each of the following. 1. Which of the following accounts could be included in an enterprise fund’s statement of net position? 2. Customers’ meter deposits that cannot be spent for no
> Putter Corporation owns 70 percent of the voting common stock of Sand Company. At December 31, 20X1, the companies reported the following: During 20X1, Sand sold inventory costing $70,000 to Putter for $100,000, and Putter resold 40 percent of the inve
> Plug Corporation holds 80 percent of Socket Company’s common stock. The following balance sheet data are presented for December 31, 20X7: Socket reported net income of $115,000 in 20X7 and paid dividends of $60,000. Its bonds have an
> Punch Manufacturing Corporation owns 80 percent of the common shares of Short Retail Stores. The companies’ balance sheets as of December 31, 20X4, were as follows: Short Retail’s 8 percent preferred stock is convert
> Poom Manufacturing used cash to acquire 75 percent of the voting stock of Satellite Industries on January 1, 20X3, at underlying book value. At that date, the fair value of the noncontrolling interest was equal to 25 percent of Satellite’s book value. Po
> Powder Corporation acquired 70 percent of Solid Company’s stock on December 31, 20X7, at underlying book value. At that date, the fair value of the noncontrolling interest was equal to 30 percent of Solid Company’s boo
> Peace Corporation acquired 100 percent of Soft Inc. in a nontaxable transaction on December 31, 20X1. The following balance sheet information is available immediately following the transaction: Additional Information: 1. The current and future effectiv
> First Boston Corporation acquired 80 percent of Gulf side Corporation common stock on January 1, 20X5. Gulf side holds 60 percent of the voting shares of Paddock Company, and Paddock owns 10 percent of the stock of First Boston. All acquisitions were mad
> Penny Manufacturing Company acquired 75 percent of Saul Corporation stock at underlying book value. At the date of acquisition, the fair value of the noncontrolling interest was equal to 25 percent of Saul’s book value. The balance shee
> Planet Corporation held 80 percent of Sun Corporation’s outstanding common shares on December 31, 20X2, which it had acquired at underlying book value. When the shares were acquired, the fair value of the non controlling interest was eq
> Power Corporation owns 75 percent of Surge Company’s stock; no intercompany purchases or sales were made in 20X4. For the year, Power and Surge reported sales of $300,000 and $200,000 and cost of goods sold of $160,000 and $95,000, respectively. Power’s
> The U.S. dollar strengthened against the European euro. Will imports from Europe into the United States be more expensive or less expensive in U.S. dollars? Explain.
> Reread the aggregate demand shock example (event #3) in Section 13.5. Suppose the parameters of the AS and AD curves take the following values:
> Reread the inflation shock example (event #1) in Section 13.5. Suppose the size of the shock is
> The Federal Reserve is obsessed with inflation, so much so that it ignores the fact that millions of American workers are unemployed. We need a Fed that fights for American jobs. We need a Fed that views any unemployment as too much unemployment, rather
> Consider the policy rule for the nominal interest rate in equation (13.5). Draw a graph with the inflation rate on the horizontal axis and the nominal interest rate on the vertical. (a) What is the slope of this line? Is it larger than 1 or less than 1?
> Consider a simplified version of the Taylor rule, where monetary policy depends only on short- run output: Rt −
> Our monetary policy rule responds only to shocks to the inflation rate. We saw in Section 13.5 that this means that aggregate demand shocks can cause the economy to undergo a “ boom- recession” cycle. Create your own monetary policy rule that would insul
> Consider the policy rule used in the chapter: Rt −
> Suppose a large number of new immigrants enter the labor market. Assume this increase in the supply of labor provides a drag on wage increases: wages rise by less than the prevailing rate of inflation over the next year. Use the short- run model to expla
> Suppose the economy is hit by an unexpected oil price shock that permanently raises oil prices by $50 per barrel. This is a temporary increase in
> The end of Section 12.4 contains a summary of the short- run model. Explain the economic reasoning that underlies each step in this summary.
> Suppose the rural part of a country is hit by a major earthquake that destroys 10 percent of the country’s housing stock. The government and private sector respond with a major construction effort to help rebuild houses. Discuss how this episode is likel
> With the goal of stabilizing output, explain how and why you would change the interest rate in response to the following shocks. Show the effects on the economy in the short run using the IS- MP diagram. (a) Consumers become pessimistic about the state
> Suppose you are appointed to chair the Federal Reserve. Your twin goals are to maintain low inflation and to stabilize economic activity—that is, to keep output at potential. Why are these appropriate goals for monetary policy?
> Using the IS- MP diagram, explain what happens to the economy if there is a temporary consumption boom that lasts for one period. (a) Initially, suppose the central bank keeps the nominal interest rate unchanged. (b) Suppose you are appointed to chair th
> In the context of the money supply- and- demand diagram, explain the effects of financial innovations like e- commerce and the increased prevalence of credit card readers in stores. Are the effects possibly related to the fact that central banks in most
> Suppose the slope of the Phillips curve—the parameter ν—increases. How would the results differ from the Volcker disinflation example considered in the chapter? What kind of changes in the economy might influence the slope of the Phillips curve?
> Go back to exercise 3 and explain what happens in the full short- run model (including the Phillips curve and allowing the economy to evolve over time). Do this for both parts (a) and (b), and be sure to provide graphs of output and inflation over time.
> The Federal Reserve exercises monetary policy by means of a very short- term, overnight nominal interest rate. Explain how changes in this overnight nominal rate influence longer- term real interest rates, and thus investment.
> The amount of goods that the U.S. economy imports might depend on the current state of the economy as well as on potential GDP. For example, when the economy is booming, imports usually rise. To incorporate this channel into the model, suppose the import
> Show how to derive an IS curve that includes the consumption multiplier. That is, show how to derive equation (11.16). Draw a graph of the original IS curve and the IS curve that includes the multiplier. Which one is flatter, and why?
> By how much does GDP rise in each of the following scenarios? Explain. (a) A computer company buys parts from a local distributor for $1 million, assembles the parts, and sells the resulting computers for $2 million. (b) A real estate agent sells a house
> Using the FRED database, construct a graph containing two data series, one for real GDP (“GDPC1”) and another for real government consumption and investment expenditures (“GCEC96”). Use the “Add Data Series” option to add a second variable to your graph.
> Suppose a large earthquake destroys many houses and buildings on the West Coast but fortunately results in little loss of life. Show how to think about this event using the IS curve. Explain how actual output, potential output, and short- run output are
> Suppose the government announces an increase in Social Security transfers. Which aggregate demand parameter is affected? How and why is it affected? How does this increase affect the graph of the IS curve? How does your answer depend on the way in which
> Suppose Congress and the president decide to increase government purchases today, say for national defense. Explain how this affects the IS curve. How does your answer depend on the way in which the spending is financed and on the extent to which Ricardi
> Consider the following changes in the macro economy. Show how to think about them using the IS curve, and explain how and why GDP is affected in the short run. (a) The government offers a temporary investment tax credit: for each dollar of investment tha
> According to the permanent income hypothesis, how does your consumption change in each of the following scenarios? (The first question is answered for you.) To keep things simple, suppose the interest rate is 10% and you will live forever. Feel free to g
> According to the life- cycle/permanent- income hypothesis, consumption depends on the present discounted value of income. An increase in the real interest rate will make future income worth less, thereby reducing the present discounted value and reducing
> The University of Chicago Booth School of Business hosts an online panel of economic experts every two weeks or so to consider a timely economic question. A specific economic opinion is put forward, and the experts either “agree” or “disagree.” Most of t
> Many economists have recommended higher capital requirements to solve the problems associated with financial crises. (a) What is a capital requirement? (b) How could higher capital requirements potentially help the economy in terms of financial stability
> Consider the following balance sheets for two hypothetical financial institutions, bank B and bank C: (a) Fill in the missing entries in the balance sheets (denoted ???). (b) What is the leverage ratio in each bank? (c) Suppose housing prices fall shar
> Apply the supply- and- demand model to the following markets. In each case, state the key endogenous variables in the market as well as some important exogenous variables or parameters. Also, express each model as a system of mathematical equations. As a
> Choose two financial institutions and look up their balance sheets online. (For example, Yahoo! Finance provides these data in an easily accessible form at http://finance.yahoo.com/q/bs?s=GS.) What is the leverage ratio of the two companies you’ve chosen
> By now, you are relatively familiar with recent economic events in the United States. But what about Europe? Write two paragraphs about the state of the economy in the Euro area over the past several years. What has happened to inflation, real GDP growth
> Using the FRED database, create a graph of the price of crude oil since 1987 based on “Crude Oil Brent— Europe.” (a) Display this graph. (b) How much more expensive (in nominal terms) is oil today than it was in the 1990s? (A rough average for the earlie
> Pick two figures from this chapter, and update them to include the latest available data. What does this tell you about how the economy has evolved since the Great Recession?
> A real-world problem faced by policymakers, forecasters, and businesses every day is how to judge the state of the economy. Consider the table below, showing hypothetical measures of real GDP in the coming years, starting at a level of $18.0 trillion in
> Suppose the economy exhibits a large, unexpected increase in productivity growth that lasts for a decade. Policymakers are (quite reasonably) slow to learn what has happened to potential output and incorrectly interpret the increase in output as a boom t
> Consider an economy that begins with output at its potential level and a relatively high inflation rate of 6%, reflecting some recent oil price shocks. As the head of the Federal Reserve, your job is to pick a sequence of short-run output levels that wil
> Draw a graph with a steep Phillips curve and a graph with a gently sloped Phillips curve. (a) Explain how the two economies respond differently to a boom and to a slump. (b) What are some factors that might influence the slope of the Phillips curve? (c)
> Using the FRED database, locate the Congressional Budget Office’s measure of potential GDP by searching for “GDPPOT.” Using the “Add Data Series” option, add the series “GDPA” (real annual GDP) to this graph. Adjust the sliders to show the data from arou
> Suppose the inflation rate is 5%. Suppose the marginal product of capital in a firm is 8% but that in the course of production, 6% of capital is worn out by depreciation. What is the nominal return associated with an investment in capital, and why? What
> Now we add some parameters to the labor market model: labor supply: Ls =
> Suppose the real return on investing in a machine is 5% and the inflation rate is 4%. (a) According to the Fisher equation, what should the nominal interest rate be? (b) Suppose bank A charges a nominal interest rate on loans equal to 8%. What happens? (
> What is the key endogenous variable in the quantity theory? Explain the effect on this key variable of the following changes: (a) The money supply is doubled. (b) The velocity of money increases by 10%. (c) Real GDP rises by 2%. (d) The money supply incr
> Using the FRED database, download a graph of the inflation rate for China and India. (For help with using the FRED data, see Case Study “The FRED Database” Chapter 2 on page 34.) (a) Display the two graphs. (b) What is the average inflation rate in each
> As in exercise 15, the amount of money the government raises from the inflation tax is DM. (a) Write this amount as a ratio to nominal GDP. Multiply and divide by M to get an expression for the ratio of revenue from the inflation tax to GDP. Your answer
> The amount of money the government raises from the inflation tax is DM. Use the FRED database for the last period in each year to answer the following questions: (a) How much currency was in circulation in 1981? What was the size of the monetary base in
> The complete version of the Thomas Sargent quote that began this chapter is “Persistent high inflation is always and everywhere a fiscal phenomenon.” Why did Sargent include the modifiers “persistent high”?
> Consider two possible inflation scenarios. In one, the inflation rate is 100% per year, but it has been at this level for three decades and the central bank says it will keep it there forever. In the other, the inflation rate was 3% for two decades but j
> Consider the following two questions. (a) Can the real interest rate be negative? In what circumstances? (b) Can the nominal interest rate be negative? Discuss.
> Using the FRED database, create a single graph containing the 10-year government bond yield (one measure of a nominal interest rate) and the inflation rate for Italy. You may find it helpful to use the search terms “government bond yield Italy” and “infl
> Using the data on the consumer price index reported in Table 8.1, calculate the value in 2015 of the following items (refer to the nearest year in the table to do each calculation): (a) The salary of a worker in 1900: $1,000 per year. (b) Bab
> Consider an economy that produces oranges and boomerangs. The prices and quantities of these goods in two different years are reported in the table below. Fill in the missing entries. Percentage change 2020-2021 2020 2021 Quantity of oranges Quantit
> In the text, we supposed a college education raised a person’s wage by $30,000 per year, from $40,000 to $70,000. Assume the interest rate is 3% and there is no growth in wages, then answer the following. (a) Suppose you are a high school senior deciding
> To make the calculation of the present discounted value of a worker’s human capital more realistic, suppose labor income starts at $50,000 initially, but then grows at a constant rate of 2% per year after that. Let wt be labor income in year t, so that w
> Review the discussion of the value of a typical worker’s human capital in Section 7.6 on page 191. (a) Re compute the present discounted value in the following cases: R = 0.01, R = 0.02, R = 0.04, R = 0.05. (b) What is the economic intuition for why t
> Repeat exercise 4 for an interest rate of 1%, then for an interest rate of 5%. Arrange your answers in a table so you can more easily see the difference a change in the interest rate makes. Data from exercise 4: Suppose scientists discover a new way to
> Suppose the government decides to reform the tax system to reduce the marginal income tax rate across the board. Explain the effect on wages, the employment- population ratio, and unemployment.
> Using the FRED database, download graphs of the U.S. employment- population ratio for men and women. (For help with FRED, see the case study “The FRED Database” in Chapter 2 on page 34.) (a) Display the graphs. (b) What are some possible explanations fo
> GDP per hour: Assume annual hours worked per person in the United States is equal to 800. Using the data from Table 7.2 and the “Country Snapshots” file (snapshots.pdf), compute GDP per hour for the other c
> Consider the following two proposals to reform unemployment insurance. Explain the arguments for and against each reform. (a) The insurance payment would be increased so that it replaced 100% of a worker’s regular labor income for 26 weeks. (b) Each work
> Suppose the U.S. unemployment rate in October 2009 had been 6% instead of 10.0%. How many more people would have been working (assuming the labor force remained the same)?
> Consider the following variation: Yt = A1/2 t Lyt , ∆ At+1 = z At Lat , Lyt + Lat =
> Look back at Table 2.4. Some missing entries are labeled with question marks. Compute the values that belong in these positions. Table 2.4: TABLE 2.4 Real and Nominal GDP in a Simple Economy, 2018–2020 Percentage change 2019
> In 2015, the U.S. National Income Accounts began to “count” intellectual property products— such as R&D, computer software, books, music, and movies— explicitly as investment. More correctly, they had previously assumed these products were an intermediat

