Question: Explain how we “read” the three scatter
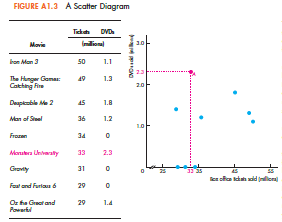
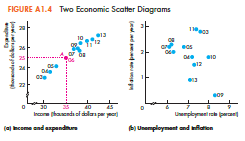
Explain how we “read†the three scatter diagrams in Figs. A1.3 and A1.4.
Transcribed Image Text:
FIGURE A1.3 A Scatter Diagram Tickah DVD Movie lioal kon Man 3 50 1.1 1.3 The Hanger Gomar: Catting fire 49 20 Despkable Me 2 45 1.8 Man of Steel 36 1.2 10 Frozen 34 Morutera Lhharaty 33 2.3 Gravitly 31 es oka dah sld liona Foal and Farlau 6 29 Oz ha Greet and Pwert 29 1.4 FIGURE A1.4 Two Economic Scatter Diograms o eas ID 24 22 35 Incom phaend el dalan par yeer Unempoyneet ree prant (a ncome and axpandu b Unemployment and flaten arp
> Classify the following pairs of goods and services as substitutes in production, complements in production, or neither. a. Bottled water and health club memberships b. French fries and baked potatoes c. Leather boots and leather shoes d. Hybrids and SUVs
> Think about the demand for the three game consoles: Xbox One, PlayStation 4, and Wii U. Explain the effect of each of the following events on the demand for Xbox One games and the quantity of Xbox One games demanded, other things remaining the same. The
> The price of gasoline has increased during the past year. a. Explain why the law of demand applies to gasoline just as it does to all other goods and services. b. Explain how the substitution effect influences gasoline purchases and provide some examples
> The money price of a textbook is $90 and the money price of the Wii game Super Mario Galaxy is $45. a. What is the opportunity cost of a textbook in terms of the Wii game? b. What is the relative price of the Wii game in terms of textbooks?
> What are the gains from specialization and trade?
> Why do people specialize and trade?
> Distinguish between comparative advantage and absolute advantage.
> What gives a person a comparative advantage?
> What are the flows in the market economy that go from firms to households and the flows from households to firms?
> Why are social institutions such as firms, markets, property rights, and money necessary?
> What is the opportunity cost of economic growth?
> What conditions must be satisfied if resources are used efficiently?
> What is allocative efficiency and how does it relate to the production possibilities frontier?
> What is marginal benefit? How is it measured?
> What is marginal cost? How is it measured?
> Why does the PPF bow outward and what does that imply about the relationship between opportunity cost and the quantity produced?
> Why is opportunity cost a ratio?
> Inexpensive broadband access has created a generation of television producers for whom the Internet is their native medium. As they redirect the focus from TV to computers, cellphones, and iPods, the video market is developing into an open digital networ
> Answer the following questions. a. How does the discovery of new oil and gas reserves change Canada’s PPF? b. How do technological advances in the production of other goods and services change Canada’s PPF? c. How are Husky’s discoveries changing Canada’
> The table describes the preferences in Yucatan. a. What is the marginal benefit from sunscreen and how is it measured? b. Use the table in Problem 11. What does Yucatan produce to achieve allocative efficiency? Wileg p (klogrom d loed pe Suraaren pe
> In Problem 11, what is the marginal cost of 1 kilogram of food in Yucatan when the quantity produced is 150 kilograms per day? What is special about the marginal cost of food in Yucatan? Problem 11: Suppose that Yucatan’s production po
> Suppose that Yucatan’s production possibilities are: What feature of a PPF illustrates increasing opportunity cost? Explain why Yucatan’s opportunity cost does or does not increase. Food Suracreen kkgam pe no fu p
> Suppose that Yucatan’s production possibilities are: a. Draw a graph of Yucatan’s PPF and explain how your graph illustrates a tradeoff. b. If Yucatan produces 150 kilograms of food per month, how much sunscreen must
> For 50 years, Cuba has had a centrally planned economy in which the government makes the big decisions on how resources will be allocated. a. Why would you expect Cuba’s production possibilities (per person) to be smaller than those of Canada? b. What ar
> Suppose that Tessa buys a new machine that enables her to make 20 jackets an hour. (She can still make only 80 caps per hour.) a. Who now has a comparative advantage in producing jackets? b. Can Sue and Tessa still gain from trade? c. Would Sue and Tessa
> On a graph of the circular flows in the market economy indicate the real and money flows in which the following items belong: a. You buy an iPad from the Apple Store. b. Apple Inc. pays the designers of the iPad. c. Apple Inc. decides to expand and rents
> In an hour, Sue can produce 40 caps or 4 jackets and Tessa can produce 80 caps or 4 jackets. a. Calculate Sue’s opportunity cost of producing a cap. b. Calculate Tessa’s opportunity cost of producing a cap. c. Who has a comparative advantage in producing
> A farm grows wheat and produces pork. The marginal cost of producing each of these products increases as more of it is produced. a. Make a graph that illustrates the farm’s PPF. b. The farm adopts a new technology that allows it to use fewer resources to
> Distinguish between production efficiency and allocative efficiency. Explain why many production possibilities achieve production efficiency but only one achieves allocative efficiency.
> Brazil produces ethanol from sugar, and the land used to grow sugar can be used to grow food crops. The table sets out Brazil’s production possibilities for ethanol and food crops: Define marginal benefit. Explain how it is measured an
> Brazil produces ethanol from sugar, and the land used to grow sugar can be used to grow food crops. The table sets out Brazil’s production possibilities for ethanol and food crops: Define marginal cost and calculate Brazilâ€
> Brazil produces ethanol from sugar, and the land used to grow sugar can be used to grow food crops. The table sets out Brazil’s production possibilities for ethanol and food crops: Does Brazil face an increasing opportunity cost of eth
> Brazil produces ethanol from sugar, and the land used to grow sugar can be used to grow food crops. The table sets out Brazil’s production possibilities for ethanol and food crops: a. If Brazil increases ethanol production from 40 barr
> Brazil produces ethanol from sugar, and the land used to grow sugar can be used to grow food crops. The table sets out Brazil’s production possibilities for ethanol and food crops: a. Draw a graph of Brazil’s PPF and
> The table gives data about umbrellas: price, the number purchased, and rainfall in millimetres (mm). What happens in the graph in Problem 21 if the rainfall increases from 200 mm to 400 mm? Problem 21: Draw a graph to show the relationship between the
> The table gives data about umbrellas: price, the number purchased, and rainfall in millimetres (mm). What happens in the graph in Problem 21 if the price rises and rainfall is constant? Problem 21: Draw a graph to show the relationship between the pric
> Tony and Patty produce skis and snowboards. The tables show their production possibilities. Tony produces 5 snowboards and 40 skis a week; Patty produces 10 snowboards and 5 skis a week. a. Who has a comparative advantage in producing (i) snowboards an
> Calculate the slope across the arc AB.
> The spreadsheet provides data on oil and gasoline: Column A is the year, column B is the price of oil (dollars per barrel), column C is the price of gasoline (cents per litre), column D is oil production, and column E is the quantity of gasoline refined
> The spreadsheet provides data on oil and gasoline: Column A is the year, column B is the price of oil (dollars per barrel), column C is the price of gasoline (cents per litre), column D is oil production, and column E is the quantity of gasoline refined
> The spreadsheet provides data on oil and gasoline: Column A is the year, column B is the price of oil (dollars per barrel), column C is the price of gasoline (cents per litre), column D is oil production, and column E is the quantity of gasoline refined
> Calculate the slope at point A and at point B.
> Calculate the slope of the curve in the figure in the next column at point A. 10
> Draw a graph that shows the relationship between the two variables x and y: Calculate the slope of the relationship across the arc as x increases from 4 to 5. * D 1 2 3 45 25 24 22 18 12 0
> Draw a graph that shows the relationship between the two variables x and y: Calculate the slope of the relationship between x and y when x equals 3. * D 1 2 3 45 25 24 22 18 12 0
> Draw a graph that shows the relationship between the two variables x and y: a. Is the relationship positive or negative? b. Does the slope of the relationship become steeper or flatter as the value of x increases? c. Think of some economic relationships
> The table gives data about umbrellas: price, the number purchased, and rainfall in millimetres (mm). Draw a graph to show the relationship between the price and the number of umbrellas purchased, holding the amount of rainfall constant at 200 mm. Descri
> Kim can produce 40 pies or 400 cakes an hour. Liam can produce 100 pies or 200 cakes an hour. a. Draw a graph of Kim’s PPF and Liam’s PPF and show the point at which each produces when they spend 30 minutes of each hour producing pies and 30 minutes prod
> Draw a graph of two variables whose relationship shows (i) a maximum and (ii) a minimum.
> Explain how we “read” the three graphs in Figs. A1.1 and A1.2. FIGURE A1.1 Making a Graph D end 1419 ocand -20 20,0. parahun Paite FIGURE A1.2 Two Graphs of Economic Data 1 per e and 112 milee EVeid In 2013, 1.3 b
> What are the two ways of calculating the slope of a curved line?
> Provide two microeconomic statements and two macroeconomic statements. Classify your statements as positive or normative. Explain why.
> Look at today’s National Post. What is the leading economic news story? With which of the big economic questions does it deal and what tradeoffs does it discuss or imply?
> What might be an incentive for you to take a class in summer school? List some of the benefits and costs involved in your decision. Would your choice be rational?
> When Costco opened a gas bar just off Highway 401, the neighbourhood was swamped with cars as drivers lined up to get the discount of 10 cents a litre. a. What is the opportunity cost of a litre of gas? Explain. b. To control the crowd, Costco hires traf
> How does a successful movie illustrate self-interested choices that are also in the social interest?
> How does the creation of a successful movie influence what, how, and for whom goods and services are produced?
> Kim can produce 40 pies or 400 cakes an hour. Liam can produce 100 pies or 200 cakes an hour. a. Calculate Kim’s opportunity cost of a pie and Liam’s opportunity cost of a pie. b. If each spends 30 minutes of each hour producing pies and 30 minutes produ
> Explain what change will bring a shift of a curve.
> Explain what change will bring a movement along a curve.
> How do we graph a relationship among more than two variables?
> Which of the relationships in Questions 4 and 5 is a positive relationship and which is a negative relationship? Questions 4: Draw a graph to show the relationship between two variables that move in the same direction. Questions 5: Draw a graph to show
> Draw a graph to show the relationship between two variables that move in opposite directions.
> Draw a graph to show the relationship between two variables that move in the same direction.
> Explain what scatter diagrams show and why we use them.
> The night before an economics test, you decide to go to the movies instead of staying home and working your MyEconLab Study Plan. You get 50 percent on your test compared with the 70 percent that you normally score. a. Did you face a tradeoff? b. What wa
> Explain how the following news headlines concern self-interest and the social interest. a. Starbucks Expands in China b. McDonald’s Moves into Gourmet Coffee c. Food Must Be Labelled with Nutrition Data
> How is economics used as a policy tool?
> Toyota will continue to produce 3 million cars per year and will use the balance of its resources to upgrade its workers’ skills and create new technology. In three years’ time, Toyota plans to produce better cars and be more productive. a. What is the o
> How do economists try to disentangle cause and effect?
> What is a model? Can you think of a model that you might use in your everyday life?
> Distinguish between a positive statement and a normative statement and provide examples.
> Use headlines from the recent news to illustrate the potential for conflict between self-interest and the social interest.
> Find an example of the distinction between microeconomics and macroeconomics in today’s headlines.
> Find examples of scarcity in today’s headlines.
> Describe the broad facts about what, how, and for whom goods and services are produced.
> The Russian government spent $6.7 billion on Olympic facilities and $16.7 billion upgrading Sochi area infrastructure. Sponsors spent $27.6 billion on hotels and facilities hoping to turn Sochi into a year-round tourist magnet. Was the opportunity cost o
> The table gives the price of a balloon ride, the temperature, and the number of rides a day. Draw a graph to show the relationship between the price and the number of rides when the temperature is 20°C. Describe this relationship Baloon r
> Calculate the slope of the relationship at point A and at point B. 100 40 1.5 10
> How does the production possibilities frontier illustrate production efficiency?
> Calculate the slope of the following relationship. 10 10 120
> The spreadsheet provides the economic data: Column A is the year, column B is the inflation rate, column C is the interest rate, column D is the growth rate, and column E is the unemployment rate. Draw a scatter diagram of the interest rate and the unemp
> The spreadsheet provides the economic data: Column A is the year, column B is the inflation rate, column C is the interest rate, column D is the growth rate, and column E is the unemployment rate. Draw a scatter diagram of the growth rate and the unemplo
> The spreadsheet provides the economic data: Column A is the year, column B is the inflation rate, column C is the interest rate, column D is the growth rate, and column E is the unemployment rate. Draw a scatter diagram of the inflation rate and the inte
> The table gives the price of a balloon ride, the temperature, and the number of rides a day. What happens in the graph in Problem 10 if the temperature rises to 30°C? Problem 10: Draw a graph to show the relationship between the price and th
> Explain in which of the years Canada’s standard of living (i) increased and (ii) decreased. Year Real CDP Papulatien $1,311 billion 32.9 million $1,320 billion 3.3 million $1,284 billion 3.7 million $1,325 billion 34.1 million 2007
> The table lists some data for Canada in 2008. Item…………………………………………….. Billions of dollars Wages paid to labour……..……..……..……..……..……… 815 Consumption expenditure……..……..……..…………... 885 Net domestic income at factor cost……..………….. 1,210 Investment……..……..
> The table lists some data for Canada in 2008. Item…………………………………………….. Billions of dollars Wages paid to labour……..……..……..……..……..……… 815 Consumption expenditure……..……..……..…………... 885 Net domestic income at factor cost……..………….. 1,210 Investment……..……..
> How does the growth rate of real GDP contribute to an improved standard of living?
> How is real GDP calculated?
> In response to the Gates Malaria Forum in October 2007, countries are debating the pros and cons of eradication. Dr. Arata Kochi of the World Health Organization believes that with enough money malaria cases could be cut by 90 percent, but it would be ve
> What is the distinction between nominal GDP and real GDP?
> What adjustments must be made to total income to make it equal GDP?
> What is the income approach to measuring GDP?
> What is the expenditure approach to measuring GDP?
> What are the distinctions between domestic and national, and gross and net?
> China’s gross domestic product grew 11.4 percent last year and marked a fifth year of double-digit growth. The increase was especially remarkable given that the United States is experiencing a slowdown due to the sub-prime crisis and housing slump. Citig
> The table lists some data for Xanadu in 2014. Item………………………………………….. Billions of dollars Wages paid to labour…………….…………….…………. 800 Consumption expenditure…………….……………… 1,000 Profit, interest, and rents…………….…………………. 340 Investment…………….…………….…………….…………..
> The table lists some data for Xanadu in 2014. Item………………………………………….. Billions of dollars Wages paid to labour…………….…………….…………. 800 Consumption expenditure…………….……………… 1,000 Profit, interest, and rents…………….…………………. 340 Investment…………….…………….…………….…………..
> The components and robots for Toyota’s auto assembly lines in Canada are built in Japan. Toyota assembles cars for the Canadian market in Ontario. Explain where these activities appear in Japan’s National Income and Expenditure Accounts.

