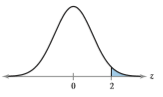
Question: Find the area of the shaded region
Find the area of the shaded region under the standard normal curve. If convenient, use technology to find the area.
Transcribed Image Text:
2.
> Draw a normal curve with a mean of 450 and a standard deviation of 50. Describe how you constructed the curve and discuss its features.
> Write the binomial probability in words. Then, use a continuity correction to convert the binomial probability to a normal distribution probability. P(x ≤ 36)
> Draw a normal curve with a mean of 60 and a standard deviation of 12. Describe how you constructed the curve and discuss its features.
> Find the indicated probability using the standard normal distribution. If convenient, use technology to find the probability. P(z < -1.22 or z > 1.32)
> Find the indicated probability using the standard normal distribution. If convenient, use technology to find the probability. P(z < -2.58 or z > 2.58)
> Find the indicated probability using the standard normal distribution. If convenient, use technology to find the probability. P(-1.54 < z < 1.54)
> Find the indicated probability using the standard normal distribution. If convenient, use technology to find the probability. P(-1.78 < z < 1.78)
> Find the indicated probability using the standard normal distribution. If convenient, use technology to find the probability. P(0 < z < 0.525)
> Find the indicated probability using the standard normal distribution. If convenient, use technology to find the probability. P(-0.89 < z < 0)
> Find the indicated probability using the standard normal distribution. If convenient, use technology to find the probability. P(z > -1.85)
> Draw two normal curves that have the same mean but different standard deviations. Describe the similarities and differences.
> Find the indicated probability using the standard normal distribution. If convenient, use technology to find the probability. P(z > 2.175)
> Write the binomial probability in words. Then, use a continuity correction to convert the binomial probability to a normal distribution probability. P(x ≥ 25)
> Find the indicated probability using the standard normal distribution. If convenient, use technology to find the probability. P(z < -0.18)
> Find the indicated probability using the standard normal distribution. If convenient, use technology to find the probability. P(z < 1.16)
> Find the probability of z occurring in the shaded region of the standard normal distribution. If convenient, use technology to find the probability. 1.68
> Find the probability of z occurring in the shaded region of the standard normal distribution. If convenient, use technology to find the probability. -1 0 1
> Find the probability of z occurring in the shaded region of the standard normal distribution. If convenient, use technology to find the probability. 1.28
> Find the probability of z occurring in the shaded region of the standard normal distribution. If convenient, use technology to find the probability. -2.125
> Find the probability of z occurring in the shaded region of the standard normal distribution. If convenient, use technology to find the probability. -0.625 0
> Find the probability of z occurring in the shaded region of the standard normal distribution. If convenient, use technology to find the probability. 1.96
> a. Find the z-score that corresponds to each value and b. Determine whether any of the values are unusual. The test scores for the Law School Admission Test (LSAT) are normally distributed. In a recent year, the mean test score was 155.69 and the standa
> What do the inflection points on a normal distribution represent? Where do they occur?
> A binomial experiment is given. Determine whether you can use a normal distribution to approximate the binomial distribution. If you can, find the mean and standard deviation. If you cannot, explain why. A survey of U.S. likely voters found that 11% thin
> a. Find the z-score that corresponds to each value and b. Determine whether any of the values are unusual. The test scores for the verbal reasoning and the quantitative reasoning sections of the Graduate Record Examination (GRE) are normally distributed
> You are performing a study about weekly per capita milk consumption. A previous study found weekly per capita milk consumption to be normally distributed, with a mean of 48.7 fluid ounces and a standard deviation of 8.6 fluid ounces. You randomly sample
> You work for a consumer watchdog publication and are testing the advertising claims of a tire manufacturer. The manufacturer claims that the life spans of the tires are normally distributed, with a mean of 40,000 miles and a standard deviation of 4000 mi
> Find the indicated area under the standard normal curve. If convenient, use technology to find the area. To the left of z = -1.44 and to the right of z = 2.21
> Find the indicated area under the standard normal curve. If convenient, use technology to find the area. To the left of z = -1.28 and to the right of z = 1.28
> Find the indicated area under the standard normal curve. If convenient, use technology to find the area. Between z = -2.33 and z = 2.33
> Find the indicated area under the standard normal curve. If convenient, use technology to find the area. Between z = -1.55 and z = 1.55
> Find the indicated area under the standard normal curve. If convenient, use technology to find the area. Between z = -1.53 and z = 0
> Find the indicated area under the standard normal curve. If convenient, use technology to find the area. Between z = 0 and z = 2.86
> Find the indicated area under the standard normal curve. If convenient, use technology to find the area. To the right of z = 1.485
> A binomial experiment is given. Determine whether you can use a normal distribution to approximate the binomial distribution. If you can, find the mean and standard deviation. If you cannot, explain why. A survey of U.S. adults found that 75% support lab
> What is the total area under the normal curve?
> Find the indicated area under the standard normal curve. If convenient, use technology to find the area. To the right of z = -0.355
> Find the indicated area under the standard normal curve. If convenient, use technology to find the area. To the right of z = 3.25
> Find the indicated area under the standard normal curve. If convenient, use technology to find the area. To the right of z = -0.65
> Find the indicated area under the standard normal curve. If convenient, use technology to find the area. To the left of z = 1.365
> Find the indicated area under the standard normal curve. If convenient, use technology to find the area. To the left of z = -2.575
> Find the indicated area under the standard normal curve. If convenient, use technology to find the area. To the left of z = -3.16
> Find the indicated area under the standard normal curve. If convenient, use technology to find the area. To the left of z = 0.17
> Find the area of the shaded region under the standard normal curve. If convenient, use technology to find the area. -225
> Find the area of the shaded region under the standard normal curve. If convenient, use technology to find the area. -0.7 1.2
> Find the indicated probabilities and interpret the results. The mean annual salary for magnetic resonance imaging (MRI) technologists is about $72,000. A random sample of 50 MRI technologists is selected. What is the probability that the mean annual sala
> Basketball player Dwight Howard makes a free throw shot about 56% of the time. Find the probability that a. the first free throw shot he makes is the fourth shot, b. the first free throw shot he makes is the second or third shot, and c. he does not ma
> Find the area of the shaded region under the standard normal curve. If convenient, use technology to find the area. -23
> In a normal distribution, which is greater, the mean or the median? Explain.
> Find the area of the shaded region under the standard normal curve. If convenient, use technology to find the area. -15
> Find the area of the shaded region under the standard normal curve. If convenient, use technology to find the area. 13
> Determine whether the graph could represent a variable with a normal distribution. Explain your reasoning. If the graph appears to represent a normal distribution, estimate the mean and standard deviation. 12 13 14 15 16 17 18 19
> Determine whether the graph could represent a variable with a normal distribution. Explain your reasoning. If the graph appears to represent a normal distribution, estimate the mean and standard deviation. 8 9 10 11 12 13 14 15
> Determine whether the graph could represent a variable with a normal distribution. Explain your reasoning. If the graph appears to represent a normal distribution, estimate the mean and standard deviation. 10 11 12 13 14 15 16 17
> Determine whether the graph could represent a variable with a normal distribution. Explain your reasoning. If the graph appears to represent a normal distribution, estimate the mean and standard deviation. 2 3 4 6.
> Determine whether the graph could represent a variable with a normal distribution. Explain your reasoning. If the graph appears to represent a normal distribution, estimate the mean and standard deviation. 15 16 17 18 19 20 21 22
> Find the indicated probabilities and interpret the results. The mean annual salary for intermediate level life insurance underwriters is about $61,000. A random sample of 45 intermediate level life insurance underwriters is selected. What is the probabil
> Determine whether the graph could represent a variable with a normal distribution. Explain your reasoning. If the graph appears to represent a normal distribution, estimate the mean and standard deviation. 45 46 47 48 49 s0 51 52
> A z-score is 0. Which of these statements must be true? Explain your reasoning. a. The mean is 0. b. The corresponding x-value is 0. c. The corresponding x-value is equal to the mean.
> Find three real-life examples of a continuous variable. Which do you think may be normally distributed? Why?
> In your own words, describe the difference between the value of x in a binomial distribution and in a geometric distribution.
> Find the indicated probability using the Poisson distribution. Find P(5) when µ = 9.8.
> Find the indicated probability using the Poisson distribution. Find P(2) when µ = 1.5.
> Find the indicated probability using the Poisson distribution. Find P(3) when µ = 6.
> Find the indicated probability using the Poisson distribution. Find P(4) when µ = 5.
> Find the indicated probability using the geometric distribution. Find P(8) when p = 0.28.
> Use the fact that the variance of the Poisson distribution is σ2 = µ. The mean number of bankruptcies filed per hour by businesses in the United States in 2016 was about 2.8. a. Find the variance and the standard deviation. Interpret the results. b. Fi
> Find the indicated probabilities and interpret the results. The mean MCAT total score in a recent year is 500. A random sample of 32 MCAT total scores is selected. What is the probability that the mean score for the sample is a. less than 503, b. more
> Use the fact that the variance of the Poisson distribution is σ2 = µ. In a recent year, the mean number of strokes per hole for golfer Steven Bowditch was about 4.1. a. Find the variance and standard deviation. Interpret the results. b. Find the probabi
> Use the fact that the mean of a geometric distribution is µ = 1/p and the variance is σ2 = q/p2. A company assumes that 0.5% of the paychecks for a year were calculated incorrectly. The company has 200 employees and examines the payroll records from one
> Find the indicated probability using the geometric distribution. Find P(2) when p = 1.5.
> Use the fact that the mean of a geometric distribution is µ = 1/p and the variance is σ2 = q/p2. A daily number lottery chooses three balls numbered 0 to 9. The probability of winning the lottery is 1/1000. Let x be the number of times you play the lotte
> Binomial experiments require that any sampling be done with replacement because each trial must be independent of the others. The hypergeometric distribution also has two outcomes: success and failure. The sampling, however, is done without replacement.
> An automobile manufacturer finds that 1 in every 2500 automobiles produced has a specific manufacturing defect. a. Use a binomial distribution to find the probability of finding 4 cars with the defect in a random sample of 6000 cars. b. The Poisson dis
> Find the indicated probabilities using the geometric distribution, the Poisson distribution, or the binomial distribution. Then determine whether the events are unusual. If convenient, use a table or technology to find the probabilities. The mean number
> Find the indicated probabilities using the geometric distribution, the Poisson distribution, or the binomial distribution. Then determine whether the events are unusual. If convenient, use a table or technology to find the probabilities. In Akron, Ohio,
> Find the indicated probabilities using the geometric distribution, the Poisson distribution, or the binomial distribution. Then determine whether the events are unusual. If convenient, use a table or technology to find the probabilities. Sixty-eight perc
> Find the indicated probabilities using the geometric distribution, the Poisson distribution, or the binomial distribution. Then determine whether the events are unusual. If convenient, use a table or technology to find the probabilities. Sixty-eight perc
> Find the indicated probabilities and interpret the results. The mean ACT composite score in a recent year is 20.8. A random sample of 36 ACT composite scores is selected. What is the probability that the mean score for the sample is a. less than 21.6,
> Find the indicated probabilities using the geometric distribution, the Poisson distribution, or the binomial distribution. Then determine whether the events are unusual. If convenient, use a table or technology to find the probabilities. Sixty-three perc
> Find the indicated probabilities using the geometric distribution, the Poisson distribution, or the binomial distribution. Then determine whether the events are unusual. If convenient, use a table or technology to find the probabilities. Fifty-one percen
> Find the indicated probabilities using the geometric distribution, the Poisson distribution, or the binomial distribution. Then determine whether the events are unusual. If convenient, use a table or technology to find the probabilities. The mean number
> Find the indicated probability using the geometric distribution. Find P(1) when p = 0.45.
> Find the indicated probabilities using the geometric distribution, the Poisson distribution, or the binomial distribution. Then determine whether the events are unusual. If convenient, use a table or technology to find the probabilities. The mean number
> Find the indicated probabilities using the geometric distribution, the Poisson distribution, or the binomial distribution. Then determine whether the events are unusual. If convenient, use a table or technology to find the probabilities. A cereal maker p
> Find the indicated probabilities using the geometric distribution, the Poisson distribution, or the binomial distribution. Then determine whether the events are unusual. If convenient, use a table or technology to find the probabilities. A glass manufact
> Find the indicated probabilities using the geometric distribution, the Poisson distribution, or the binomial distribution. Then determine whether the events are unusual. If convenient, use a table or technology to find the probabilities. The probability
> Find the indicated probabilities using the geometric distribution, the Poisson distribution, or the binomial distribution. Then determine whether the events are unusual. If convenient, use a table or technology to find the probabilities. Football player
> Find the indicated probabilities using the geometric distribution, the Poisson distribution, or the binomial distribution. Then determine whether the events are unusual. If convenient, use a table or technology to find the probabilities. A newspaper find
> Find the indicated probabilities and interpret the results. Refer to Exercise 34. A random sample of six days is selected. Find the probability that the mean surface concentration of carbonyl sulfide for the sample is a. between 5.1 and 15.7 picomoles p
> Find the indicated probabilities using the geometric distribution, the Poisson distribution, or the binomial distribution. Then determine whether the events are unusual. If convenient, use a table or technology to find the probabilities. The mean number
> Find the indicated probabilities using the geometric distribution, the Poisson distribution, or the binomial distribution. Then determine whether the events are unusual. If convenient, use a table or technology to find the probabilities. An auto parts se
> Find the indicated probabilities using the geometric distribution, the Poisson distribution, or the binomial distribution. Then determine whether the events are unusual. If convenient, use a table or technology to find the probabilities. The probability
> In your own words, describe the difference between the value of x in a binomial distribution and in the Poisson distribution.
> Find the indicated probability using the geometric distribution. Find P(3) when p = 0.65.
> Identify the unusual values of x in each histogram in Exercises 3–5.
> The histogram represents a binomial distribution with probability of success p. Match the histogram with the appropriate number of trials n. Explain your reasoning. What happens as the value of n increases and p remains the same? a. n = 4 b. n = 8
> The histogram represents a binomial distribution with probability of success p. Match the histogram with the appropriate number of trials n. Explain your reasoning. What happens as the value of n increases and p remains the same? a. n = 4 b. n = 8
> The histogram represents a binomial distribution with probability of success p. Match the histogram with the appropriate number of trials n. Explain your reasoning. What happens as the value of n increases and p remains the same? a. n = 4 b. n = 8
> The histogram represents a binomial distribution with 5 trials. Match the histogram with the appropriate probability of success p. Explain your reasoning. a. p = 0.25 b. p = 0.50 c. p = 0.75 P(x) 0.40 0.30 - 0.20 0.10 0 1 2 3 4 5

