Question: Find the mean, the median, and the
Find the mean, the median, and the mode of the data, if possible. If any measure cannot be found or does not represent the center of the data, explain why.
The numbers of weeks the 33 longest leading Hot 100 songs remained at number 1 as of November 19, 2016
Transcribed Image Text:
> Both data sets shown in the histograms have a mean of 50. One has a standard deviation of 2.4, and the other has a standard deviation of 5. By looking at the histograms, which is which? Explain your reasoning. (a) (b) 20 20 15 15 10 10 42 45 48 51 54
> Find the range, mean, variance, and standard deviation of the sample data set. The durations (in days) of pregnancies for a random sample of mothers 277 291 295 280 268 278 291 277 282 279 296 285 269 293 267 281 286 269 264 299 275
> Find the range, mean, variance, and standard deviation of the sample data set. The ages (in years) of a random sample of students in a campus dining hall 19 20 17 19 17 21 23 21 17 17 19 19 17 20 23 18 18 18 18 19
> Find the range, mean, variance, and standard deviation of the population data set. The densities (in kilograms per cubic meter) of the ten most abundant elements by weight in Earth’s crust 1.4 2330 2700 7870 1500 970 900 1740 4500 0
> Find the range, mean, variance, and standard deviation of the population data set. The numbers of alcohol-impaired crash fatalities (in thousands) per year from 2005 through 2015 14 13 13 12 11 10 10 10 10 10 10
> In Exercise 11, compare your answer to part (a) with your answer to part (b). How do outliers affect the range of a data set? From Exercise 11: The depths (in inches) at which 10 artifacts are found are listed. a. Find the range of the data set. b. Ch
> The depths (in inches) at which 10 artifacts are found are listed. a. Find the range of the data set. b. Change 38.5 to 60.5 and find the range of the new data set. 20.7 24.8 30.5 26.2 36.0 34.3 30.3 29.5 27.0 38.5
> What is the difference between class limits and class boundaries?
> Find the range of the data set represented by the graph. 75 80 85 90 95 ::
> Explain how to find the range of a data set. What is an advantage of using the range as a measure of variation? What is a disadvantage?
> Determine whether the approximate shape of the distribution in the histogram is symmetric, uniform, skewed left, skewed right, or none of these. Justify your answer. 22 20 18 16 14 12 10 8 6- 4- 2 25,000 45,000 65,000 85,000
> Construct the described data set. The entries in the data set cannot all be the same. Mean, median, and mode are the same.
> Construct the described data set. The entries in the data set cannot all be the same. Mean is not representative of a typical number in the data set.
> Construct the described data set. The entries in the data set cannot all be the same. Mean and mode are the same.
> Construct a frequency distribution and a frequency histogram for the data set using the indicated number of classes. Describe the shape of the histogram as symmetric, uniform, negatively skewed, positively skewed, or none of these. Number of classes: 6
> Construct a frequency distribution and a frequency histogram for the data set using the indicated number of classes. Describe the shape of the histogram as symmetric, uniform, negatively skewed, positively skewed, or none of these. Number of classes: 5
> Construct a frequency distribution and a frequency histogram for the data set using the indicated number of classes. Describe the shape of the histogram as symmetric, uniform, negatively skewed, positively skewed, or none of these. Number of classes: 6
> Construct a frequency distribution and a frequency histogram for the data set using the indicated number of classes. Describe the shape of the histogram as symmetric, uniform, negatively skewed, positively skewed, or none of these. Number of classes:
> Construct a frequency distribution for the data set using the indicated number of classes. In the table, include the midpoints, relative frequencies, and cumulative frequencies. Which class has the greatest class frequency and which has the l
> Approximate the mean of the frequency distribution. The populations (in thousands) of the parishes of Louisiana in 2015 Population (in thousands) 0-49 Frequency 41 50-99 100–149 150–199 2 200-249 1 250–299 2 300–349 350–399 1 400-449 2
> Approximate the mean of the frequency distribution. The gas mileages (in miles per gallon) for 24 family sedans Gas Mileage (in miles per gallon) Frequency 22–27 16 28-33 2 34–39 2 40-45 4
> Construct the described data set. The entries in the data set cannot all be the same. Median and mode are the same.
> Approximate the mean of the frequency distribution. The gas mileages (in miles per gallon) for 30 small cars Gas Mileage (in miles per gallon) Frequency 29–33 11 34–38 12 39-43 2 44-48 5
> In Exercise 46, one of the student’s B grades gets changed to an A. What is the student’s new grade point average? From Exercise 46: A student receives the grades shown below, with an A worth 4 points, a B worth 3 points, a C worth 2 points, and a D wor
> In Exercise 41, an error was made in grading your final exam. Instead of getting 93, you scored 85. What is your new weighted mean? From Exercise 41: The scores and their percents of the final grade for a statistics student are shown below. What is the
> Find the weighted mean of the data. A student receives the grades shown below, with an A worth 4 points, a B worth 3 points, a C worth 2 points, and a D worth 1 point. What is the student’s grade point average? A in 1 four-credit class B in 2 three-cred
> Find the weighted mean of the data. The mean scores for students in a statistics course (by major) are shown below. What is the mean score for the class? 9 engineering majors: 85 5 math majors: 90 13 business majors: 81
> Find the weighted mean of the data. For the month of October, a credit card has a balance of $115.63 for 12 days, $637.19 for 6 days, $1225.06 for 7 days, $0 for 2 days, and $34.88 for 4 days. What is the account’s mean daily balance for October?
> Find the weighted mean of the data. For the month of April, a checking account has a balance of $523 for 24 days, $2415 for 2 days, and $250 for 4 days. What is the account’s mean daily balance for April?
> Use the ogive in Exercise 25 to approximate a. the cumulative frequency for a weight of 201.5 pounds. b. the weight for which the cumulative frequency is 68. c. the number of black bears that weigh between 158.5 pounds and 244.5Â pounds. d
> Find the weighted mean of the data. The scores and their percents of the final grade for an archaeology student are shown below. What is the student’s mean score? Score Percent of final grade Quizzes 100 20% Midterm exam 89 30% Stud
> Find the weighted mean of the data. The scores and their percents of the final grade for a statistics student are shown below. What is the student’s mean score? Score Percent of final grade Homework 85 5% Quizzes 80 35% Project/Spee
> Without performing any calculations, determine which measure of central tendency best represents the graphed data. Explain your reasoning. Body Mass Indexes (BMI) of People in a Gym 8 3. 18 20 2 24 26 28 30 BMI kouonbosa
> Determine whether the statement is true or false. If it is false, rewrite it as a true statement. When each data class has the same frequency, the distribution is symmetric.
> Without performing any calculations, determine which measure of central tendency best represents the graphed data. Explain your reasoning. Heart Rates of a Sample of Adults 45 40- 35 15 10 5s 60 65 0 is 80 85 Heart rate (in bcats per minute) Frequenc
> Without performing any calculations, determine which measure of central tendency best represents the graphed data. Explain your reasoning. Heights of Players on Two Opposing Volleyball Teams 6. 70 71 12 73 74 75 76 7 Height (in inches) kouan basg
> Without performing any calculations, determine which measure of central tendency best represents the graphed data. Explain your reasoning. How Often Do You Change Jobs? 1250 1000 750- 500 250 Every 1-3 years Every 4-5 yearn Stayed at one job for more
> Identify any clusters, gaps, or outliers. Model Year 2017 Hybrid Electric Cars 600 1200 Annual fuel cost (in dollars) 1800 2700 3000 Frequency -N -u 900 1500 2100 2400
> Identify any clusters, gaps, or outliers. Model Year 2017 Ethanol Flexible Fuel Vehicles 20 16 12 250 300 350 400 450 500 550 600 Driving range (in miles) Frequency
> Find the mean, the median, and the mode of the data, if possible. If any measure cannot be found or does not represent the center of the data, explain why. Prices (in dollars) of Flights from Chicago to Alanta 100 140 180 220 260 300
> Use the ogive in Exercise 25 to approximate a. the cumulative frequency for a weight of 201.5 pounds. b. the weight for which the cumulative frequency is 68. c. the number of black bears that weigh between 158.5 pounds and 244.5 pounds. d. the number
> Find the mean, the median, and the mode of the data, if possible. If any measure cannot be found or does not represent the center of the data, explain why. Times (in minutes) It Takes Employees to Drive to Work 10 15 20 25 30 35 40
> Find the mean, the median, and the mode of the data, if possible. If any measure cannot be found or does not represent the center of the data, explain why. Grade Point Averages of Students in a Class o | 8 15 6 8 21 3 4 5 30 4 0 0 Key: 0|8 = 0.8
> Find the mean, the median, and the mode of the data, if possible. If any measure cannot be found or does not represent the center of the data, explain why. Weights (in pounds) of Packages on a Delivery Truck 0 5 8 1013 6 2 13 3 3 6 77 3 012 4 4 4 5 7
> Find the mean, the median, and the mode of the data, if possible. If any measure cannot be found or does not represent the center of the data, explain why. The pie chart at the left shows the responses of a sample of 352 small-business owners who were as
> Determine whether the statement is true or false. If it is false, rewrite it as a true statement. A data set can have the same mean, median, and mode.
> Find the mean, the median, and the mode of the data, if possible. If any measure cannot be found or does not represent the center of the data, explain why. The class levels of 25 students in a physics course Freshman: 2 Junior: 10 Sophomore: 5 Senior
> Find the mean, the median, and the mode of the data, if possible. If any measure cannot be found or does not represent the center of the data, explain why. The responses of a sample of 34 young adult United Kingdom males in custodial sentences who were a
> Find the mean, the median, and the mode of the data, if possible. If any measure cannot be found or does not represent the center of the data, explain why. The responses of a sample of 5330 shoppers who were asked how their purchases are made are shown i
> Find the mean, the median, and the mode of the data, if possible. If any measure cannot be found or does not represent the center of the data, explain why. The numbers of patients who responded to various combinations of electroconvulsive therapy, medica
> Use the ogive to approximate a. the number in the sample. b. the location of the greatest increase in frequency. Adult Males 80 70 60 50 40 30 20 10 +++++ 74 64 66 68 70 72 76 Height (in inches) Cumulative frequency
> Find the mean, the median, and the mode of the data, if possible. If any measure cannot be found or does not represent the center of the data, explain why. The durations (in minutes) of power failures at a residence in the last 10 years 18 26 45 75 1
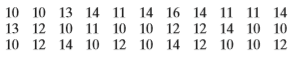
> Find the mean, the median, and the mode of the data, if possible. If any measure cannot be found or does not represent the center of the data, explain why. The maximum numbers of passenger vehicle lanes at 16Â Canadian border ports of entry
> Find the mean, the median, and the mode of the data, if possible. If any measure cannot be found or does not represent the center of the data, explain why. The cholesterol levels of a sample of 10 female employees 154 240 171 188 235 203 184 173 181
> Find the mean, the median, and the mode of the data, if possible. If any measure cannot be found or does not represent the center of the data, explain why. The 2016–2017 tuition and fees (in thousands of dollars) for the top 14 universi
> Find the mean, the median, and the mode of the data, if possible. If any measure cannot be found or does not represent the center of the data, explain why. The ages of the new members of the House of Representatives in the 115th Congress from Florida as
> Determine whether the statement is true or false. If it is false, rewrite it as a true statement. Some quantitative data sets do not have medians.
> Find the mean, the median, and the mode of the data, if possible. If any measure cannot be found or does not represent the center of the data, explain why. The lengths (in words) of seven articles from The New York Post 650 1242 788 1462 662 709 803
> Find the mean, the median, and the mode of the data, if possible. If any measure cannot be found or does not represent the center of the data, explain why. The Law School Admission Test (LSAT) scores for a sample of seven students accepted into a law sch
> Find the mean, the median, and the mode of the data, if possible. If any measure cannot be found or does not represent the center of the data, explain why. The numbers of credits being taken by a sample of 14 full-time college students for a semester
> Match the distribution with one of the graphs in Exercises 9–12. Justify your decision. The frequency distribution of weights for a sample of seventh-grade boys 10. 22 20 15 18 12 16 14 12 9 10 6. 6. 4 3 2 25,000 45,000 65,000 85,00
> Use the ogive to approximate a. the number in the sample. b. the location of the greatest increase in frequency. Black Bears Weight (in pounds) Cumulative frequency 72.5 115.5 158.5 201.5 244.5 287.5 330.5 373.5 416.5 459.5
> Match the distribution with one of the graphs in Exercises 9–12. Justify your decision. The frequency distribution of scores on a 90-point test where a few students scored much lower than the majority of students 10. 22 20 15 18 12
> Match the distribution with one of the graphs in Exercises 9–12. Justify your decision. The frequency distribution of mileages of service vehicles at a business where a few vehicles have much higher mileages than the majority of vehicle
> Match the distribution with one of the graphs in Exercises 9–12. Justify your decision. The frequency distribution of 180 rolls of a dodecagon (a 12-sided die) 10. 22 20 15 18 12 16 14 12 9 10 6. 6. 4 3 2 25,000 45,000 65,000 85,00
> Determine whether the approximate shape of the distribution in the histogram is symmetric, uniform, skewed left, skewed right, or none of these. Justify your answer. 16 12 8 4 52.5 62.5 72.5 82.5
> Determine whether the approximate shape of the distribution in the histogram is symmetric, uniform, skewed left, skewed right, or none of these. Justify your answer. 18 15 12 9- 3 12 3 4 5 6 7 8 9 10 11 12
> Determine whether the approximate shape of the distribution in the histogram is symmetric, uniform, skewed left, skewed right, or none of these. Justify your answer. 15- 12- 9. 6 3 85 95 105 115 125 135 145 155
> Determine whether the statement is true or false. If it is false, rewrite it as a true statement. The mean is the measure of central tendency most likely to be affected by an outlier.
> Use the stem-and-leaf plot or dot plot to list the actual data entries. What is the maximum data entry? What is the minimum data entry? 2|7 32 41334778 5 011233 3444456689 6 888 7388 85 Key: 2|7 = 27
> Match the plot with the description of the sample. a. Times (in minutes) it takes a sample of employees to drive to work b. Grade point averages of a sample of students with finance majors c. Top speeds (in miles per hour) of a sample of high-performa
> Match the plot with the description of the sample. a. Times (in minutes) it takes a sample of employees to drive to work b. Grade point averages of a sample of students with finance majors c. Top speeds (in miles per hour) of a sample of high-performa
> Use the relative frequency histogram to a. identify the class with the greatest, and the class with the least, relative frequency. b. approximate the greatest and least relative frequencies. c. describe any patterns with the data. Campus Security
> Use the frequency distribution to find the a. class width, b. class midpoints, and c. class boundaries. Toledo, OH, Average Normal Temperatures (°F) Class Frequency, S 25-32 86 33-40 39 41-48 41 49-56 48 57-64 43 65-72 68 7
> Classify the statement as an example of classical probability, empirical probability, or subjective probability. Explain your reasoning. The chance that Corporation A’s stock price will fall today is 75%.
> Classify the statement as an example of classical probability, empirical probability, or subjective probability. Explain your reasoning. The probability of randomly selecting five cards of the same suit from a standard deck of 52 playing cards is about 0
> Classify the statement as an example of classical probability, empirical probability, or subjective probability. Explain your reasoning. On the basis of prior counts, a quality control officer says there is a 0.05 probability that a randomly chosen part
> Use the Fundamental Counting Principle. The state of Virginia’s license plates have three letters and four digits. Assuming that any letter or digit can be used, how many different license plates are possible?
> Use counting principles to find the probability. A corporation has six male senior executives and four female senior executives. Four senior executives are chosen at random to attend a technology seminar. What is the probability of choosing a. four men?
> Use counting principles to find the probability. A class of 40 students takes a statistics exam. The results are shown in the table at the left. Three students are selected at random. What is the probability that a. all three students received an A? b.
> Use counting principles to find the probability. A shipment of 200 calculators contains 3 defective units. What is the probability that a sample of three calculators will have a. no defective calculators? b. all defective calculators? c. at least one
> Use counting principles to find the probability. A security code consists of three letters and one digit. The first letter cannot be A, B, or C. What is the probability of guessing the security code on the first try?
> Use the Fundamental Counting Principle. A student must choose from 7 classes to take at 8:00 a.m., 4 classes to take at 9:00 a.m., and 3 classes to take at 10:00 a.m. How many ways can the student arrange the schedule?
> Use counting principles to find the probability. A full house consists of three of one kind and two of another kind. You are dealt a hand of five cards from a standard deck of 52 playing cards. Find the probability of being dealt a full house consisting
> Use combinations and permutations. An employer must hire 2 people from a list of 13 applicants. In how many ways can the employer choose to hire the 2 people?
> Use combinations and permutations. A literary magazine editor must choose 4 short stories for this month’s issue from 17 submissions. In how many ways can the editor choose this month’s stories?
> Use combinations and permutations. Five players on a basketball team must each choose a player on the opposing team to defend. In how many ways can the players choose their defensive assignments?
> Use combinations and permutations. Fifteen cyclists enter a race. How many ways can the cyclists finish first, second, and third?
> Perform the indicated calculation. 5C3/10C3
> Perform the indicated calculation. 7C4
> Perform the indicated calculation. 8P6
> Perform the indicated calculation. 11P2
> You are given that P(A or B)= 0.55 and P(A)+ P(B)= 1. Do you have enough information to find P(A and B)? Explain.
> Identify the sample space of the probability experiment and determine the number of outcomes in the event. Draw a tree diagram when appropriate. Experiment: Guessing the gender(s) of the three children in a family Event: Guessing that the family has two
> You are given that P(A)= 0.15 and P(B)= 0.40. Do you have enough information to find P(A or B)? Explain.
> Use the Pareto chart, which shows the results of a survey in which 3078 adults were asked with which social class they identify. Find the probability of randomly selecting an adult who does not identify as upper or lower class. Americans' Social Cla
> Use the Pareto chart, which shows the results of a survey in which 3078 adults were asked with which social class they identify. Find the probability of randomly selecting an adult who does not identify as middle class. Americans' Social Class Self-
> Use the Pareto chart, which shows the results of a survey in which 3078 adults were asked with which social class they identify. Find the probability of randomly selecting an adult who identifies as working or lower class. Americans' Social Class Se
> Use the Pareto chart, which shows the results of a survey in which 3078 adults were asked with which social class they identify. Find the probability of randomly selecting an adult who identifies as middle or upper-middle class. Americans' Social Cl
> Use the pie chart at the left, which shows the percent distribution of the number of students in U.S. public schools in a recent year. Find the probability of randomly selecting a school with 300 or more students. Students in Public Schools 1000 or

