Question: For each rational function, (A) Find any
For each rational function,
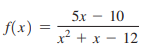
(A) Find any intercepts for the graph.
(B) Find any vertical and horizontal asymptotes for the graph.
(C) Sketch any asymptotes as dashed lines. Then sketch a graph of f.
(D) Graph the function in a standard viewing window using a graphing calculator.
> Graph each function in over the indicated interval.
> Match each equation with the graph of f, g, h, or k in the figure. (A) y = (¼) x (B) y = (0.5) x (C) y = 5x (D) y = 3x
> Use the graph of each line to find the x intercept, y intercept, and slope. Write the slope-intercept form of the equation of the line.
> From the dawn of humanity to 1830, world population grew to one billion people. In 100 more years (by 1930) it grew to two billion, and 3 billion more were added in only 60 years (by 1990). In 2016, the estimated world population was 7.4 billion with a r
> In 2015, the estimated population of Brazil was 204 million with a relative growth rate of 0.77%. (A) Write an equation that models the population growth in Brazil, letting 2015 be year 0. (B) Based on the model, what is the expected population of Brazi
> Refer to Problem 63. Light intensity I relative to depth d (in feet) for one of the clearest bodies of water in the world, the Sargasso Sea, can be approximated by I = I0e - 0.00942d where I0 is the intensity of light at the surface. What percentage of
> Table 5 shows estimates of mobile data traffic, in exabytes 11018 bytes2 per month, for years from 2015 to 2020. (A) Let x represent the number of years since 2015 and find an exponential regression model (y = abx ) for mobile data traffic. (B) Use the
> People assigned to assemble circuit boards for a computer manufacturing company undergo on-the-job training. From past experience, the learning curve for the average employee is given by N = 40 ( 1 - e - 0.12t ) where N is the number of boards assem
> Refer to Problem 57. The following rates for 60-month certificates of deposit were also taken from BanxQuote websites: (A) Oriental Bank & Trust, 1.35% compounded quarterly (B) BMW Bank of North America, 1.30% compounded monthly (C) BankFirst Corporat
> A couple just had a baby. How much should they invest now at 5.5% compounded daily in order to have $40,000 for the child’s education 17 years from now? Compute the answer to the nearest dollar.
> Suppose that $4,000 is invested at 6% compounded weekly. How much money will be in the account in (A) ½ year? (B) 10 years? Compute answers to the nearest cent.
> Find the value of an investment of $24,000 in 7 years if it earns an annual rate of 4.35% compounded continuously.
> Graph each function over the indicated interval.
> Find the Solution Set x - 2 ≥ 2(x – 5)
> Graph each function over the indicated interval.
> Solve each equation for x. (Remember: ex ( 0 and e - x ( 0 for all values of x).
> Solve each equation for x. (Remember: ex ( 0 and e - x ( 0 for all values of x).
> Solve each equation for x. (Remember: ex ( 0 and e - x ( 0 for all values of x).
> Solve each equation for x. (Remember: ex ( 0 and e - x ( 0 for all values of x).
> Solve each equation for x.
> Solve each equation for x.
> Solve each equation for x.
> Solve each equation for x.
> Solve each equation for x.
> Use the graph of each line to find the x intercept, y intercept, and slope. Write the slope-intercept form of the equation of the line.
> Find real numbers a and b such that a ( b but a4 = b4. Explain why this does not violate the third exponential function property in Theorem 2 on page 98.
> Graph each function over the indicated interval.
> Graph each function over the indicated interval.
> Graph each function over the indicated interval.
> Use the graph of ( shown in the figure to sketch the graph of each of the following. (A) y = ((x) + 2 (B) y = ((x – 3) (C) y = 2 ((x) - 4 (D) y = 4 - ((x + 2)
> describe verbally the transformations that C can be used to obtain the graph of g from the graph of ((see Section 2.2).
> describe verbally the transformations that C can be used to obtain the graph of g from the graph of f (see Section 2.2).
> describe verbally the transformations that C can be used to obtain the graph of g from the graph of f (see Section 2.2).
> describe verbally the transformations that C can be used to obtain the graph of g from the graph of f (see Section 2.2).
> Graph each function in over the indicated interval.
> Find the Solution Set -314 - x2 = 5 - 1x + 12
> For each polynomial function find the following: (A) Degree of the polynomial (B) All x intercepts (C) The y intercepts ((x) = (x – 5)2 (x + 7)2
> For each polynomial function find the following: (A) Degree of the polynomial (B) All x intercepts (C) The y intercepts ((x) = 5x6 + x4 + 4x8 + 10
> For each polynomial function find the following: (A) Degree of the polynomial (B) All x intercepts (C) The y intercepts ((x) = 30 - 3x
> For each polynomial function find the following: (A) Degree of the polynomial (B) All x intercepts (C) The y intercepts ((x) = x2 - 5x + 6
> Refer to Table 5. (A) Let x represent the number of years since 1960 and find a cubic regression polynomial for the divorce rate. (B) Use the polynomial model from part (A) to estimate the divorce rate (to one decimal place) for 2025.
> n 1917, L. L. Thurstone, a pioneer in quantitative learning theory, proposed the rational function to model the number of successful acts per unit time that a person could accomplish after x practice sessions. Suppose that for a particular person enroll
> Refer to Table 4. (A) Let x represent the number of years since 2000 and find a cubic regression polynomial for the per capita consumption of eggs. (B) Use the polynomial model from part (A) to estimate (to the nearest integer) the per capi
> The financial department of a hospital, using statistical methods, arrived at the cost equation C(x) = 20x3 - 360x2 + 2,300x - 1,000 1 ( x ( 12 where C(x) is the cost in thousands of dollars for handling x thousand cases per month. The average cost per
> Financial analysts in a company that manufactures DVD players arrived at the following daily cost equation for manufacturing x DVD players per day: C(x) = x2 + 2x + 2,000 The average cost per unit at a production level of x players per day is C(x) = C(x
> A company manufacturing surfboard has fixed costs of $300 per day and total costs of $5,100 per day at a daily output of 20 boards. (A) Assuming that the total cost per day, C(x), is linearly related to the total output per day, x, write an equation for
> Write an equation of the line with the indicated slope and y intercept.
> Write an equation for the lowest-degree polynomial function with the graph and intercepts shown in the figure.
> Write an equation for the lowest-degree polynomial function with the graph and intercepts shown in the figure.
> For each rational function, (A) Find any intercepts for the graph. (B) Find any vertical and horizontal asymptotes for the graph. (C) Sketch any asymptotes as dashed lines. Then sketch a graph of f. (D) Graph the function in a standard viewing window
> For each rational function, (A) Find any intercepts for the graph. (B) Find any vertical and horizontal asymptotes for the graph. (C) Sketch any asymptotes as dashed lines. Then sketch a graph of f. (D) Graph the function in a standard viewing window
> Find the equations of any vertical asymptotes.
> Find the equations of any vertical asymptotes.
> Find the equations of any vertical asymptotes.
> Find the equation of any horizontal asymptote.
> Find the equation of any horizontal asymptote.
> Find the solution set -3y + 9 + y = 13 - 8y
> Find the equation of any horizontal asymptote.
> Find the equation of any horizontal asymptote.
> Compare the graph of y = -x5 to the graph of y = - x5 + 5x3 - 5x + 2 in the following two viewing windows: (A) -5 ( x ( 5, -5 ( y ( 5 (B) -5 ( x ( 5, -500 ( y ( 500
> Compare the graph of y = x3 to the graph of y = x3 - 2x + 2 in the following two viewing windows: (A) -5 ( x ( 5, -5 ( y ( 5 (B) -5 ( x ( 5, -500 ( y ( 500
> For each rational function, (A) Find the intercepts for the graph. (B) Determine the domain. (C) Find any vertical or horizontal asymptotes for the graph. (D) Sketch any asymptotes as dashed lines. Then sketch a graph of y = ((x)
> For each rational function, (A) Find the intercepts for the graph. (B) Determine the domain. (C) Find any vertical or horizontal asymptotes for the graph. (D) Sketch any asymptotes as dashed lines. Then sketch a graph of y = ((x)
> For each rational function, (A) Find the intercepts for the graph. (B) Determine the domain. (C) Find any vertical or horizontal asymptotes for the graph. (D) Sketch any asymptotes as dashed lines. Then sketch a graph of y = ((x)
> What is the minimum number of x intercepts that a polynomial of degree 6 can have? Explain.
> What is the maximum number of x intercepts that a polynomial of degree 7 can have?
> Each graph is the graph of a polynomial function. Answer the following questions for each graph: (A) What is the minimum degree of a polynomial function that could have the graph? (B) Is the leading coefficient of the polynomial negative or positive?
> Write an equation of the line with the indicated slope and y intercept. Slope = 1 y intercept = 5
> Each graph is the graph of a polynomial function. Answer the following questions for each graph: (A) What is the minimum degree of a polynomial function that could have the graph? (B) Is the leading coefficient of the polynomial negative or positive?
> Each graph is the graph of a polynomial function. Answer the following questions for each graph: (A) What is the minimum degree of a polynomial function that could have the graph? (B) Is the leading coefficient of the polynomial negative or positive?
> Each graph is the graph of a polynomial function. Answer the following questions for each graph: (A) What is the minimum degree of a polynomial function that could have the graph? (B) Is the leading coefficient of the polynomial negative or positive?
> For each polynomial function find the following: (A) Degree of the polynomial (B) All x intercepts (C) The y intercepts ((x) = (2x – 5)2 (x2 – 9)4
> Find the vertex form of each quadratic function by completing the square. ((x) = -5x2 + 15x - 11
> Find the vertex form of each quadratic function by completing the square. ((x) = 3x2 + 18x + 21
> Find the vertex form of each quadratic function by completing the square. ((x) = x2 - 12x - 8
> Find the vertex form of each quadratic function by completing the square. ((x) = x2 + 16x
> The table gives performance data for a boat powered by an Evinrude outboard motor. Find a quadratic regression model (y = ax2 + bx + c) for fuel consumption y (in miles per gallon) as a function of engine speed (in revolutions per minute). Estimate the f
> Refer to Problem 75. Find the distance from the center that the rate of flow is 30 centimeters per second. Round answer to two decimal places. Data from Problem 75: Find the distance from the center that the rate of flow is 20 centimeters per second. Ro
> Find the solution Set.
> Use the revenue function from Problem 70 and the given cost function: R(x) = x (2,000 - 60x) Revenue function C(x) = 4,000 + 500x Cost function where x is thousands of computers, and R(x) and C(x) are in thousands of dollars. Both functions have domai
> Use the revenue function from Problem 70, and the given cost function: R(x) = x(2,000 - 60x) Revenue function C(x) = 4,000 + 500x Cost function where x is thousands of computers, and C(x) and R(x) are in thousands of dollars. Both functions have do
> The marketing research department for a company that manufactures and sells notebook computers established the following price–demand and revenue functions: p(x) = 2,000 - 60x Price–demand function R(x) = xp(x) Revenue function = x (2,000 - 60x) where
> Using quadratic regression on a graphing calculator, show that the quadratic function that best fits the data on market share in Problem 66 is ((x) = -0.0117x2 + 0.32x + 17.9 Data from Problem 66:
> The table shows the retail market share of passenger cars from Ford Motor Company as a percentage of the U.S. market. A mathematical model for this data is given by ((x) = -0.0117x2 + 0.32x + 17.9 where x = 0 corresponds to 1980. (A) Complete the follo
> assume that a, b, c, h, and k are constants with a ( 0 such that ax2 + bx + c = a(x – h) 2 + k for all real numbers x. Show that:
> How can you tell from the vertex form y = a(x – h)2 + k whether a quadratic function has two real zeros?
> How can you tell from the standard form y = ax2 + bx + c whether a quadratic function has exactly one real zero?
> How can you tell from the graph of a quadratic function whether it has no real zeros?
> (A) Graph f and g in the same coordinate system. (B) Solve f1x2 = g1x2 algebraically to two decimal places. (C) Solve f1x2 7 g1x2 using parts (A) and (B). (D) Solve f1x2 6 g1x2 using parts (A) and (B). ((x)= -0.7x2 + 6.3x g(x) = 1.1x + 4.8 0 ( x (
> Find the slope and x intercept of the graph of each equation. 9x + 2y = 4
> Identify the graph(s) of lines with a positive slope.
> (A) Graph f and g in the same coordinate system. (B) Solve f1x2 = g1x2 algebraically to two decimal places. (C) Solve f1x2 7 g1x2 using parts (A) and (B). (D) Solve f1x2 6 g1x2 using parts (A) and (B). ((x) = -0.7x1x - 72 g(x) = 0.5x + 3.5 0 ( x (
> Given that f is a quadratic function with maximum ((x) = (( -3) = -5 , find the axis, vertex, range, and x intercepts.
> Solve graphically to two decimal places using a graphing calculator. 1.8x2 - 3.1x - 4.9 > 0
> Solve graphically to two decimal places using a graphing calculator 3.4 + 2.9x - 1.1x2 ( 0
> Solve graphically to two decimal places using a graphing calculator 7 + 3x - 2x2 = 0
> Use interval notation to write the solution set of the inequality x2 + 7x + 12 ( 0
> Use interval notation to write the solution set of the inequality (x + 6) (x – 3) < 0
> First write each function in vertex form; then find each of the following (to two decimal places): (A) Intercepts (B) Vertex (C) Maximum or minimum (D) Range n(x) = -0.15x2 - 0.90x + 3.3
> First write each function in vertex form; then find each of the following (to two decimal places): (A) Intercepts (B) Vertex (C) Maximum or minimum (D) Range m(x) = 0.20x2 - 1.6x - 1

