Question: Founded in February 2004, Facebook is a
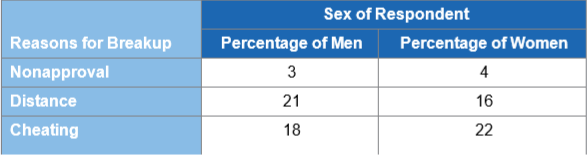
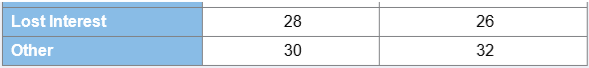
Founded in February 2004, Facebook is a social utility that helps people communicate with their friends and family. In just six years, Facebook had acquired more than 500 million active users, of which 50% logged on to Facebook in any given day. In a survey of 3,000 Facebook users, the designers looked at why Facebook users break up in a relationship (The Wall Street Journal, November 27–28, 2010).
Source: Internal survey of 3,000 Facebook users.
Suppose the survey consisted of 1,800 men and 1,200 women. Use the data to determine whether the reasons for breakup depend on one’s sex at the 1% significance level. Provide the details.
Transcribed Image Text:
Sex of Respondent Percentage of Men Percentage of Women Reasons for Breakup 3 4 Nonapproval 21 16 Distance 18 22 Cheating Lost Interest 28 26 Other 30 32
> In a multiple regression, the following sample regression equation is obtained: a. Predict y if x1 equals 20 and x2 equals 35. b. Interpret the slope coefficient of x1. ŷ = 152 + 12.9x, + 2.7x2.
> In a multiple regression, the following sample regression equation is obtained: a. Predict y if x1 equals 40 and x2 equals −10. b. Interpret the slope coefficient of x2. y = -8 + 2.6x, – 47.2x2.
> In a simple linear regression, the following sample regression equation is obtained: a. Interpret the slope coefficient. b. Predict y if x equals −15. ŷ = 436 – 17x.
> The accompanying data file shows the square footage and associated property taxes for 20 homes in an affluent suburb 30 miles outside of New York City. Estimate a home’s property taxes as a linear function of its square footage. At the 5% significance le
> The accompanying data file shows midterm and final grades for 32 students. Estimate a student’s final grade as a linear function of a student’s midterm grade. At the 1% significance level, is a student’s midterm grade significant in explaining a student’
> The accompanying table shows a portion of quarterly data on Nike’s revenue (in $ millions) for the fiscal years 2001 through 2010. Data for Nike’s fiscal year refer to the time period from June 1 through May 31. Assume
> The accompanying table shows a portion of the number of customers that frequent a restaurant on weekend days over the past 52 weeks. At the 5% significance level, can we conclude that the average number of customers that frequent the restaurant differs
> A statistics instructor wonders whether significant differences exist in her students’ final exam scores in her three different sections. She randomly selects the scores from 10 students in each section. A portion of the data is shown i
> An analyst has predicted the following returns for Stock A and Stock B in three possible states of the economy. a. What is the probability of a recession? b. Calculate the expected return for Stock A and Stock B. c. Calculate the expected return for a
> The following table shows the annual returns (in percent) for the Vanguard Energy Fund from 2005 through 2009. Year ……………………………………………………………………………………………… Energy 2005 ……………………………………………………………………………………………… 44.60 2006 ……………………………………………………………………………………………… 19.
> An economist examines the relationship between changes in short-term interest rates and long-term interest rates. He believes that changes in short-term rates are significant in explaining long-term interest rates. He estimates the model Dlong = Î&
> Do energy costs vary dramatically depending on where you live in the United States? Annual energy costs are collected from 25 households in four regions in the United States. A portion of the ANOVA table is shown. a. Complete the ANOVA table. Assume en
> The following output summarizes the results of an analysis of variance experiment in which the treatments were three different hybrid cars and the variable measured was the miles per gallon (mpg) obtained while driving the same route. Assume mpg is norma
> Consider the following competing hypotheses and accompanying sample data. Assume that the populations are normally distributed with equal variances. a. Calculate the value of the test statistic and the p-value. b. At the 5% significance level, can you
> The following values are drawn from a normal population. a. Calculate the point estimates for the population variance and the population standard deviation. b. Construct the 95% confidence interval for the population variance and the population standar
> The covariance between two random variables x and y is 100. The sample standard deviation for x is 10 and the sample standard deviation for y is 12.5. Calculate and interpret the correlation coefficient.
> Consider the following competing hypotheses and accompanying sample data drawn independently from normally distributed populations. Test whether the population means differ at the 5% significance level. Ho: H1 – 42 = 0 Hz#0 X1 = 57 X2 = 63 o1 = 11.
> In a simple linear regression based on 30 observations, it is found that b1 = 7.2 and se(b1) = 1.8. Consider the hypotheses: a. Calculate the value of the test statistic and the p-value. b. At the 5% significance level, what is the conclusion to the t
> The accompanying table shows a portion of the number of cases of car thefts for the 50 states during 2010. State ………………………………………………………………………………………………… Car Theft Alabama …………………………………………………………………………………………………… 658 Alaska …………………………………………………………………………………………
> Given the following information obtained from four normally distributed populations, construct an ANOVA table and perform an ANOVA test of mean differences at the 5% significance level. SST= 70.47; SSTR= 11.34; c= 4; n, = n2= n3= N4= 15
> Given the following information obtained from three normally distributed populations, construct an ANOVA table and perform an ANOVA test of mean differences at the 1% significance level. SSTR = 220.7; SSE = 2252.2; c = 3; n, = n2= n3= 8 %3D %3D %3D
> Find the value x for which: a. P(x2o 2 x) =0.005 b. P(Z2o 2 x) = 0.01 c. PlX20 < x) = 0.005 а. с. d. Plz2o < x) = 0.01
> Find the value x for which: a. Plx > x) = 0.025 b. Pl 2 x) = 0.05 c. P(X < x) = 0.025 d. P(X < x) = 0.05
> The accompanying table lists goodness-of-fit measures that were obtained when estimating the following two simple linear regression models: Which model provides a better fit for y? Justify your response with two goodness-of-fit measures. Model 1:
> Consider the following competing hypotheses and accompanying sample data. The two populations are known to be normally distributed. a. Implement the test at the 5% significance level under the assumption that the population variances are equal. b. Repe
> Consider the following data drawn independently from normally distributed populations: a. Construct the 95% confidence interval for the difference between the population means. Assume that the population variances are equal. b. Specify the competing hy
> Consider the following data drawn independently from normally distributed populations: a. Construct the 95% confidence interval for the difference between the population means. b. Specify the competing hypotheses in order to determine whether or not th
> Many parents have turned to St. John’s wort, an herbal remedy, to treat their children with attention deficit hyperactivity disorder (ADHD). The Journal of the American Medical Association (June 11, 2008) published an article that explo
> An economist wishes to summarize sample data from 26 metropolitan areas in the United States. The following table lists a portion of each area’s 2010–2011 median income (Income in $1,000s) as well as the monthly unempl
> A multinomial experiment produced the following results At the 1% significance level, can we reject H0: p1 = 0.30, p2 = 0.20, and p3 = 0.50? Category 3 Frequency 128 87 185
> An analyst is trying to determine whether the prices of certain stocks on the NASDAQ are independent of the industry to which they belong. She examines four industries and, within each industry, categorizes each stock according to its price (high-priced,
> A study in the Journal of the American Medical Association (February 20, 2008) found that patients who go into cardiac arrest while in the hospital are more likely to die if it happens after 11 pm. The study investigated 58,593 cardiac arrests during the
> A local TV station claims that 60% of people support Candidate A, 30% support Candidate B, and 10% support Candidate C. A survey of 500 registered voters is taken. The accompanying table indicates how they are likely to vote. a. Specify the competing h
> Although founded only in 2004, Facebook has nearly 2 billion active users, of which 50% log on to Facebook on any given day. In a survey by Facebook, young users were asked about their preference for delivering the news about breaking up a relationship (
> A study suggests that airlines have increased restrictions on cheap fares by raising overnight requirements (The Wall Street Journal, August 19, 2008). This would force business travelers to pay more for their flights, since they tend to need the most fl
> The following table lists the market shares of the four firms in a particular industry in 2010 and total sales (in $ billions) for each firm in 2011. a. Specify the competing hypotheses to test whether the market shares in 2010 are not valid in 2011. b
> The data that accompanies this exercise show miles per gallon (MPG) for a sample of 25 cars. a. Using the Jarque-Bera test, state the competing hypotheses in order to determine whether or not MPG follows the normal distribution. b. Calculate the value of
> The data that accompany this exercise show weekly stock prices for Home Depot. a. Using the Jarque-Bera test, state the competing hypotheses in order to determine whether or not Home Depot’s weekly stock prices follow the normal distribution. b. Calcula
> The following frequency distribution shows the distribution of monthly returns (in %) for Starbucks Corp. for the years 2003 through 2007 Monthly Return …………â€&br
> Investment advisors recommend risk reduction through international diversification. International investing allows you to take advantage of the potential for growth in foreign economies, particularly in emerging markets. Janice Wong is considering invest
> Total 2005 CEO compensation (in $ millions) for the largest U.S. companies by revenue is reported in the following frequency distribution. Total compensation includes salary, bonuses, stock and incentives, the potential value of stock options, and gains
> A multinomial experiment produced the following results: Can we conclude at the 1% significance level that not all population proportions are equal to 0.20? Category 1 2 4 5 Frequency 57 63 70 55 55 3.
> Fabco, a precision machining shop, uses statistical process control (SPC) techniques to ensure quality and consistency of their steel shafts. The control limits used in their SPC charts are based on the assumption that shaft diameters are normally distr
> The quality department at an electronics component manufacturer must ensure that their components will operate at prespecified levels. The accompanying table shows a frequency distribution with measured resistance values (in ohms) for a sample of 520 res
> Fifty cities provided information on vacancy rates (in percent) in local apartments in the following frequency distribution. The sample mean and the sample standard deviation are 9% and 3.6%, respectively Vacancy ………………………………………………………………………………… Rate Fre
> Applications An economics professor states on her syllabus that final grades will be distributed using the normal distribution. The final averages of 300 students are calculated, and she groups the data into a frequency distribution as shown in the accom
> At the 1% significance level, use the goodness-of-fit test for normality to determine whether or not the data are normally distributed Mean ……………………………………………………………………………………………………. 77.25 Standard Deviation ………………………………………………………………………………… 11.36 Skewness …
> The following frequency distribution has a sample mean of −3.5 and a sample standard deviation of 9.7. Class ………………………………………………………………………………………… Frequency Less than –10 ………………………………………………………………………………………... 70 –10 up to 0 ………………………………………………………………………………………
> Consider the following sample data with mean and standard deviation of 20.5 and 5.4, respectively. Class ……………………………………………………………………………………… Frequency Less than 10 ………………………………………………………………………………………. 25 10 up to 20 …………………………………………………………………………………………. 95 20
> You are considering two mutual funds as an investment. The possible returns for the funds are dependent on the state of the economy and are given in the accompanying table. You believe that the likelihood is 20% that the economy will be good, 50% that
> A study by the Massachusetts Community & Banking Council found that blacks, and, to a lesser extent, Latinos, remain largely unable to borrow money at the same interest rate as whites (The Boston Globe, February 28, 2008). The following contingency t
> According to a 2008 survey by the Pew Research Center, people in China are highly satisfied with their roaring economy and the direction of their nation (USA Today, July 22, 2008). Eighty-six percent of those who were surveyed expressed positive views of
> Consider a multinomial experiment with n = 400 and k = 3. The null hypothesis is H0: p1 = 0.60, p2 = 0.25, and p3 = 0.15. The observed frequencies resulting from the experiment are a. Specify the alternative hypothesis. b. Calculate the value of the te
> The quality manager believes there may be a relationship between the experience level of an inspector and whether a product passes or fails inspection. Inspection records were reviewed for 630 units of a particular product, and the number of units which
> A marketing agency would like to determine if there is a relationship between union membership and type of vehicle owned (domestic or foreign brand). The goal is to develop targeted advertising campaigns for particular vehicle brands likely to appeal to
> The following sample data reflect shipments received by a large firm from three different vendors and the quality of those shipments a. Specify the competing hypotheses to determine whether quality is associated with the source of the shipments. b. Con
> A market researcher for an automobile company suspects differences in preferred color between male and female buyers. Advertisements targeted to different groups should take such differences into account, if they exist. The researcher examines the most r
> According to an online survey by Harris Interactive for job site CareerBuilder.com (InformationWeek.com, September 27, 2007), more than half of IT workers say they have fallen asleep at work. The same is also true for government workers. Assume that the
> Given the following contingency table, conduct a test for independence at the 1% significance level. Variable A Variable B 1 2 3 4 1 120 112 100 110 2 127 115 120 124 3 118 115 110 124
> Given the following contingency table, conduct a test for independence at the 5% significance level. Variable A Variable B 1 2 1 23 47 32 53
> An investor considers investing $10,000 in the stock market. He believes that the probability is 0.30 that the economy will improve, 0.40 that it will stay the same, and 0.30 that it will deteriorate. Further, if the economy improves, he expects his inve
> An agricultural grain company processes and packages various grains purchased from farmers. A high-volume conveyor line contains four chutes at the end, each of which is designed to receive and dispense equal proportions of grain into bags. Each bag is t
> The quality department at an electronics company has noted that, historically, 92% of the units of a specific product pass a test operation, 6% fail the test but are able to be repaired, and 2% fail the test and need to be scrapped. Due to recent process
> An Associated Press/GfK Poll shows that 38% of American drivers favor U.S. cars, while 33% prefer Asian brands, with the remaining 29% going for other foreign cars (www.msnbc.com, April 21, 2010). A researcher wonders whether the preferences for cars hav
> Consider a multinomial experiment with n = 250 and k = 4. The null hypothesis to be tested is H0: p1 = p2 = p3 = p4 = 0.25. The observed frequencies resulting from the experiment are a. Specify the alternative hypothesis. b. Calculate the value of the
> A research analyst is examining a stock for possible inclusion in his client’s portfolio. Over a 10-year period, the sample mean and the sample standard deviation of annual returns on the stock were 20% and 15%, respectively. The client wants to know if
> Consider the following hypotheses: Find the p-value based on the following sample information, where the sample is drawn from a normally distributed population. a. s2 = 300; n = 25 b. s2 = 100; n = 25 c. Which of the above sample information enables us
> Adidas revenues (in millions of €) in the Greater China and Western Europe regions for the years 2011 through 2015 are shown in the accompanying table. Assume revenues are normally distributed. Source: Adidas Online Annual Reports. a.
> Barbara Dwyer, the manager at Lux Hotel, makes every effort to ensure that customers attempting to make phone reservations do not have to wait too long to speak with a reservation specialist. Since the hotel accepts phone reservations 24 hours a day, Bar
> An automotive parts distributor wants to standardize its safety stock level for two parts, A and B. (“Safety stock” is the excess inventory carried above the expected demand level to provide protection against demand variability.) Consequently, the distr
> At Burger Joint, consistency in product and service is the new motto. Accordingly, management has invested in an automated French-fry dispenser to replace the manual dispensing method. The goal is to standardize the number of fries provided. The accompan
> You are considering buying insurance for your new laptop computer, which you have recently bought for $1,500. The insurance premium for three years is $80. Over the three-year period there is an 8% chance that your laptop computer will require work worth
> A consumer advocacy group is concerned about the variability in the cost of a generic drug. There is cause for concern if the variance of the cost exceeds 5 ($)2. The group surveys seven local pharmacies and obtains the following prices (in $) for a part
> A random sample of 25 observations is used to estimate the population variance. The sample mean and sample standard deviation are calculated as 52.5 and 3.8, respectively. Assume that the population is normally distributed. a. Construct the 90% interval
> A replacement part for a machine must be produced within close specifications in order for it to be acceptable to customers. A production process is considered to be working properly as long as the variance in the lengths of the parts does not exceed 0.0
> The data accompanying this exercise include monthly rents for a two-bedroom apartment in two campus towns: Ann Arbor, Michigan, and Davis, California. Davis, California, is known to have higher rents than Ann Arbor, Michigan; however, it is not clear if
> A variety of packaging solutions exist for products that must be kept within a specific temperature range. Cold chain distribution is particularly useful in the food and pharmaceutical industries. A packaging company is trying out a new packaging materia
> A portion of the monthly stock prices (rounded to the nearest dollar) for Starbucks Corp. and Panera Bread Co. from 2010 to 2013 are reported in the following table. Source: www.finance.yahoo.com. a. State the null and the alternative hypotheses in or
> A marketing analyst is studying the variability in customer purchase amounts between shopping mall stores and “big box” discount stores. She suspects the variability is different between those stores due to the nature of the customers involved. To invest
> The quality manager at a battery manufacturing company wants to determine if lithium-ion batteries have less variability in discharge time than nickel-cadmium batteries. Using products with similar power draws, he has measured the time until discharge (i
> Nike’s total revenues (in millions of $) for the Asian and Latin American regions for the years 2005 through 2009 are as follows: Source: Nike Online Annual Reports. a. Specify the competing hypotheses in order to test whether the va
> The following table shows the annual returns (in percent) for Fidelity’s Electronic and Utilities funds. Source: www.finance.yahoo.com; data retrieved April 3, 2015. Test if the population variances differ at the 5% significance level
> An appliance store sells additional warranties on its refrigerators. Twenty percent of the buyers buy the limited warranty for $100 and 5% buy the extended warranty for $200. What is the expected revenue for the store from the warranty if it sells 120 re
> Two basketball players on a school team are working hard on consistency of their performance. In particular, they are hoping to bring down the variance of their scores. The coach believes that the players are not equally consistent in their games. Over a
> Consider the following competing hypotheses and relevant summary statistics: Conduct this hypothesis test at the 5% significance level. State your assumptions. (Hint: You may want to first convert the above left-tailed test into a right-tailed test by
> Use the F table to find the value x for which: F table: a. P (F (4,8) ≥ x) = 0.025 b. P (F (4,8) ≥ x) = 0.05 c. P (F (4,8) d. P (F (4,8) dfi df2 Area in Upper Tail, a 6 7 8 0.10 3.05 3.01 2.98 0.05 4.28 4.21 4.15
> Real estate investment in college towns continues to promise good returns (The Wall Street Journal, September 24, 2010). With rents holding up, this is good news for investors but the same cannot be said for students. There also tends to be significant v
> The data accompanying this exercise show miles per gallon (mpg) for 25 cars. State the null and the alternative hypotheses in order to test whether the variance differs from 62 mpg2. a. Assuming that mpg is normally distributed, calculate the value of th
> A realtor in Mission Viejo, California, believes that the standard deviation of house prices is more than 100 units, where each unit equals $1,000. Assume house prices are normally distributed. a. State the null and the alternative hypotheses for the tes
> An economist is interested in the variability of hourly wages at a production plant. She collects data on 50 hourly wage earners. a. Set up the competing hypotheses to test whether the variance of hourly wages exceeds 35 ($2). b. Calculate the value of t
> To maintain high consistency in its manual sewing operations, a custom manufacturer of high-quality fashion clothing has a goal in which all sewing employees should score within a standard deviation of 9 on a sewing dexterity test. To test adherence to t
> Metal works, a supplier of machine parts, fabricates bearings in which the standard deviation of the bearing diameter must be within 0.002-inch maximum. Otherwise, problems with fit will occur. The engineering department is conducting an experiment to in
> Monthly stock prices (in $) for two competing firms are as follows a. Calculate the sample mean, the sample variance, and the sample standard deviation for each firm’s stock price. b. Which firm had the higher average stock price ove
> The India Fund, Inc. (IFN) is a close-ended equity mutual fund launched by the Blackstone Group’s Asset Management arm. Although it promises impressive returns, it does so at the cost of greater risk. An analyst would like to test if th
> A restaurant owner is concerned about the consistency of business. He wants to determine if the standard deviation of the profits for each week is less than $300. The profits from last week are listed below (in dollars). Assume that profits are normally
> The manager of a supermarket would like the variance of the waiting times of the customers not to exceed 3 minutes-squared. She would add a new cash register if the variance exceeds this threshold. She regularly checks the waiting times of the customers
> An engineer wants to determine the effectiveness of a safety program. He collects annual loss of hours due to accidents in 12 plants before and after the program was put into operation. a. Specify the competing hypotheses that determine whether the sa
> Fresh numbers from the U.S. Department of Transportation suggest that fewer flights in the United States arrive on time than before. The explanations offered for the lackluster performance are understaffed airlines, a high volume of travelers, and overta
> The SAT is required of most students applying for college admission in the United States. This standardized test has gone through many revisions over the years. In 2005, a new writing section was introduced that includes a direct writing measure in the f
> Depression engulfs millions of Americans every day. A federal study reported that 10.9% of adults aged 18–24 identified with some level of depression versus 6.8% of adults aged 65 or older (The Boston Globe, October 18, 2010). Suppose 1,000 young adults

