Question: Recall the example of life expectancy vs.
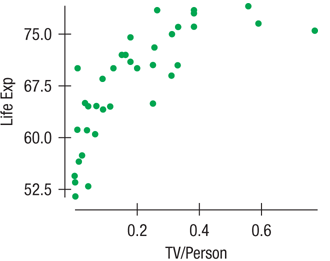
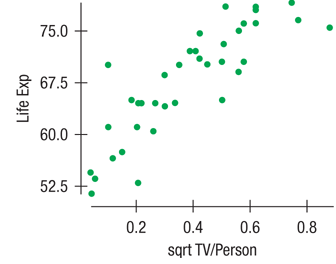
Recall the example of life expectancy vs. TVs per person in the chapter. In that example, we use the square root of TVs per person. Here are the original data and the re-expressed version. Which of the goals of re-expression does this illustrate? (Data in Doctors and life expectancy)
> A company hoping to assess employee satisfaction surveys employees by assigning computer-generated random numbers to each employee on a list of all employees and then contacting all those whose assigned random number is divisible by 7. Is this a simple r
> A professor teaching a large lecture class of 350 students samples her class by rolling a die. Then, starting with the row number on the die (1 to 6), she passes out a survey to every fourth row of the large lecture hall. She says that this is a simple r
> The company annual report states, Our survey shows that 87.34% of our employees are very happy working here. Comment on that claim. Use appropriate statistics terminology.
> The president of the university plans a speech to an alumni group. He plans to talk about the proportion of students who responded in the survey that they are the first in their family to attend college, but the first draft of his speech treats that prop
> The managers of a large company wished to know the percentage of employees who feel extremely satisfied to work there. The company has roughly 24,000 employees. They contacted a random sample of employees and asked them about their job satisfaction, obta
> The company of Exercise 2 is considering ways to survey their employees. For each of these proposed designs, identify the problem. 1. Leave a stack of surveys out in the employee cafeteria so people can pick them up and return them. 2. Stuff a questionna
> The university administration of Exercise 1 is considering a variety of ways to sample students for a survey. For each of these proposed survey designs, identify the problem. 1. Publish an advertisement inviting students to visit a website and answer que
> The company plans to have the head of each corporate division hold a meeting of their employees to ask whether they are happy on their jobs. They will ask people to raise their hands to indicate whether they are happy. What problems do you see with this
> Administrators at Texas A&M University were interested in estimating the percentage of students who are the first in their family to go to college. The A&M student body has about 46,000 members. How might the administrators answer their question by apply
> For each of these potential predictor variables, say whether they should be represented in a regression model by indicator variables. If so, then suggest what specific indicators should be used (that is, what values they would have). 1. In a regression t
> To help travelers know what to expect, researchers collected the prices of commodities in 16 cities throughout the world. Here are boxplots comparing the average prices of a bottle of water, a dozen eggs, and a cappuccino in the 16 cities (prices are all
> In Chapters 4 and 6 we’ve seen data Let look at data from the Hopkins Forest. Here a regression that models the maximum daily wind speed in terms of the average temperature and precipitation: Response variable is: Max wind (mph) R-squar
> Look back at the regression in Exercise 3. Here is the partial regression plot for the coefficient of Budget. 1. What is the slope of the least squares regression line in the partial regression plot? 2. The point plotted with a red x is the movie Avatar,
> For the movies regression in Exercise 3, here is a histogram of the residuals. What does it tell us about the assumptions and conditions below? 1. Linearity Condition 2. Nearly Normal Condition 3. Equal Spread Condition
> For the movies examined in Exercise 3, here is a scatterplot of USGross vs. Budget: What (if anything) does this scatterplot tell us about the following assumptions and conditions for the regression? 1. Linearity Condition 2. Equal Spread Condition 3. No
> A middle manager at an entertainment company, upon seeing the analysis of Exercise 3, concludes that longer movies make more money. He argues that his company films should all be padded by 30 minutes to improve their gross. Explain the flaw in his interp
> What can predict how much a motion picture will make? We have data on 609 recent releases that includes the USGross (in $M), the Budget ($M), the Run Time (minutes), and the score given by the critics on the Rotten Tomatoes website. The first several ent
> The dataset Grades shows the five scores from an Introductory statistics course. Find a model for final exam score by trying all possible models with two predictor variables. Which model would you choose? Be sure to check the conditions for multiple regr
> We saw a model in Exercise 24 for the calorie count of a breakfast cereal. Can we predict the calories of a serving from its vitamin and mineral content? Here a multiple regression model of Calories per serving on its Sodium (mg), Potassium (mg), and Sug
> We saw in Chapter 7 that the calorie content of a breakfast cereal is linearly associated with its sugar content. Is that the whole story? Here the output of a regression model that regresses Calories per serving on each serving Protein(g), Fat(g), Fiber
> The dataset on body fat contains 15 body measurements on 250 men from 22 to 81 years old. Is average %Body Fat related to Weight? Here a scatterplot: And here the simple regression: Dependent variable is: Pct BF R-squared = 38.1% s = 6.538 1. What does t
> Find data on the Internet (or elsewhere) for two or more groups. Make appropriate displays to compare the groups, and interpret what you find.
> A large section of Stat 101 was asked to fill out a survey on grade point average and SAT scores. A regression was run to find out how well Math and Verbal SAT scores could predict academic performance as measured by GPA. The regression was run on a comp
> The AFL-CIO has undertaken a study of the yearly salaries (in thousands of dollars) of 30 administrative assistants. The organization wants to predict salaries from several other variables. The variables considered to be potential predictors of salary ar
> Here are some diagnostic plots for the home prices data from Exercise 17. These were generated by a computer package and may look different from the plots generated by the packages you use. (In particular, note that the axes of the Normal probability plo
> A candy maker surveyed chocolate bars available in a local supermarket and found the following least squares regression model: Calories=28.4+11.37 Fat(g)+2.91 Sugar(g). 1. The hand-crafted chocolate she makes has 15 g of fat and 20 g of sugar. How many
> Here are some diagnostic plots for the final exam data from Exercise 13. These were generated by a computer package and may look different from the plots generated by the packages you use. (In particular, note that the axes of the Normal probability plot
> Here is the regression for the women records for the same Scottish hill races we considered in Exercise 14: Dependent variable is: Women Time (mins) R-squared = 96.7% s = 10.06 1. Compare the regression model for the women records with that found for the
> Many variables have an impact on determining the price of a house. Among these are Living Area of the house (square feet) and number of Bathrooms. Information for a random sample of homes for sale in the Statesboro, GA, area was obtained from the Interne
> A student collected nutrition data about candy bars by reading the labels in a supermarket. Because candy bars have different serving sizes, the data are given as values per serving. Here is a regression predicting calories from the sugar (g/serving). (F
> Several exercises in Chapter 7 showed that attendance Attendance at American League baseball games increased increases with the number of runs scored. But fans may respond more to winning teams than to high-scoring games. Here is a regression of average
> Hill running races up and down hills has a written history in Scotland dating back to the year 1040. Races are held throughout the year at different locations around Scotland. A recent compilation of information for 90 races (for which full information w
> Find an article in a newspaper, a magazine, or the Internet that compares two or more groups of data. 1. Does the article discuss the W? 2. Is the chosen display appropriate? Explain. 3. Discuss what the display reveals about the groups. 4. Does the arti
> How well do exams given during the semester predict performance on the final? One class had three tests during the semester. Computer output of the regression gives Dependent variable is: Final s = 13.46 R-Sq = 77.7% 1. Write the equation of the regressi
> A household appliance manufacturer wants to analyze the relationship between total sales and the company three primary means of advertising (television, magazines, and radio). All values were in millions of dollars. They found the regression equation Sal
> A regression performed to predict the selling price of houses found the equation Price=169,328+35.3 Area+0.718 Lotsize 6543 Age where Price is in dollars, Area is in square feet, Lotsize is in square feet, and Age is in years. The R2 is 92%. One of the
> For each of these potential predictor variables say whether they should be represented in a regression model by indicator variables. If so, then suggest what specific indicators should be used (that is, what values they would have). 1. In a regression to
> The following regression model was found for the houses in upstate New York considered in the chapter: Price=20,986.09 7483.10 Bedrooms+93.84 Living Area. 1. Find the predicted price of a 2-bedroom, 1000-sq-ft house from this model. 2. The house just so
> Abalones are edible sea snails that include over 100 species. A researcher is working with a model that uses the number of rings in an abalone shell to predict its age. He finds an observation that he believes has been miscalculated. After deleting this
> The production company of Exercise 7 offers advanced sales to Frequent Buyers through its website. Here a relevant scatterplot: One performer refused to permit advanced sales. What effect has that point had on the regression to model Total Revenue from A
> A regression of Total Revenue on Ticket Sales by the concert production company of Exercises 2 and 4 finds the model Revenue=14,228+36.87 Ticket Sales. 1. Management is considering adding a stadium-style venue that would seat 10,000. What does this mode
> Using data from 20 compact cars, a consumer group develops a model that predicts the stopping time for a vehicle by using its weight. You consider using this model to predict the stopping time for your large SUV. Explain why this is not advisable.
> Noting a recent study predicting the increase in cell phone costs, a friend remarks that by the time he a grandfather, no one will be able to afford a cell phone. Explain where his thinking went awry.
> Can you design a Simpson paradox? Two companies are vying for a city Best Local Employer award to be given to the company most committed to hiring local residents. Although both employers hired 300 new people in the past year, Company A brags that it des
> The concert production company of Exercise 2 made a second scatterplot, this time relating Total Revenue to Ticket Sales. 1. Describe the relationship between Ticket Sales and Total Revenue. 2. How are the results for the two venues similar? 3. How are t
> The analyst in Exercise 1 tried fitting the regression line to each market segment separately and found the following: What does this say about her concern in Exercise 1? Was she justified in worrying that the overall model Jan=$612.07+0.403 Dec might no
> Exercise 18 revisited the relationship between life expectancy and TVs per capita and saw that re-expression to the square root of TVs per capita made the plot more nearly straight. But was that the best choice of re-expression? Here is a scatterplot of
> A concert production company examined its records. The manager made the scatterplot at the top of the next column. The company places concerts in two venues, a smaller, more intimate theater (plotted with blue circles) and a larger auditorium-style venue
> Exercise 17 looked at the distribution of protein in the Burger King menu items, comparing meat and non-meat items. That exercise offered the logarithm as a re-expression of Protein. Here are two other alternatives, the square root and the reciprocal. Wo
> Recall the data about the Burger King menu items in Chapter 7. We look at data about Burger King menu items. Here are boxplots of protein content comparing items that contain meat with those that do not. The plot on the right graphs log(Protein). Which o
> Suppose you have fit a linear model to some data and now take a look at the residuals. For each of the following possible residuals plots, tell whether you would try a re-expression and, if so, why.
> Suppose you have fit a linear model to some data and now take a look at the residuals. For each of the following possible residuals plots, tell whether you would try a re-expression and, if so, why.
> An athletic director proudly states that he has used the average GPAs of the university sports teams and is predicting a high graduation rate for the teams. Why is this method unsafe?
> A 1975 article in the magazine Science examined the graduate admissions process at Berkeley for evidence of sex discrimination. The table below shows the number of applicants accepted to each of four graduate programs: 1. What percent of total applicants
> A team of calculus teachers is analyzing student scores on a final exam compared to the midterm scores. One teacher proposes that they already have every teacher class averages and they should just work with those averages. Explain why this is problemati
> The correlation between cell phone usage and life expectancy is very high. Should we buy cell phones to help people live longer?
> There is a strong correlation between the temperature and the number of skinned knees on playgrounds. Does this tell us that warm weather causes children to trip?
> The researcher in Exercise 9 is content with the second regression. But he has found a number of shells that have large residuals and is considering removing all of them. Is this good practice?
> An analysis of spending by a sample of credit card bank cardholders shows that spending by cardholders in January (Jan) is related to their spending in December (Dec): The assumptions and conditions of the linear regression seemed to be satisfied and an
> Here are the residuals for a regression of Sales on Number of Sales People Working for the bookstore of Exercise 5: 1. What are the units of the residuals? 2. Which residual contributes the most to the sum that was minimized according to the least square
> An online investment blogger advises investing in mutual funds that have performed badly the past year because regression to the mean tells us that they will do well next year. Is he correct?
> A CEO complains that the winners of his rookie junior executive of the year award often turn out to have less impressive performance the following year. He wonders whether the award actually encourages them to slack off. Can you offer a better explanatio
> Recall the data on disk drives we saw in Chapter 6, Exercise 4. Look at data on disk drives in the table below. Suppose we want to predict Price from Capacity. 1. Find the slope estimate, b1. 2. What does it mean, in this context? 3. Find the intercept,
> Recall the data we saw in Chapter 6, Exercise 3 for a bookstore. Below are data for a bookstore. The manager wants to predict Sales from Number of Sales People Working. 1. Find the slope estimate, b1 2. What does it mean, in this context? 3. Find the int
> A company must decide which of two delivery services it will contract with. During a recent trial period, the company shipped numerous packages with each service and kept track of how often deliveries did not arrive on time. Here are the data: 1. Compare
> The newborn grandson of one of the authors was 48 cm long and weighed 3 kg. According to the regression model of Exercise 3, what was his residual? What does that say about him?
> A least squares regression line was calculated to relate the length (cm) of newborn boys to their weight in kg. The line is weight^=5.94+0.1875 length. Explain in words what this model means. Should new parents (who tend to worry) be concerned if their n
> If false, explain briefly. 1. Some of the residuals from a least squares linear model will be positive and some will be negative. 2. Least squares means that some of the squares of the residuals are minimized. 3. We write y^ to denote the predicted value
> Here is a scatterplot of the residuals from the regression of the hard drive prices on their sizes from Exercise 6. 1. Are any assumptions or conditions violated? If so, which ones? 2. What would you recommend about this regression?
> Here are residual plots (residuals plotted against predicted values) for three linear regression models. Indicate which condition appears to be violated (Linearity, Outlier, or Equal Spread) in each case.
> For the hard drive data of Exercise 6, find and interpret the value of R2.
> For the regression model for the bookstore of Exercise 5, what is the value of R2 and what does it mean?
> Here are the residuals for a regression of Price on Capacity for the hard drives of Exercise 6 (based on the hand-computed coefficients). 1. Which residual contributes the most to the sum that is minimized by the least squares criterion? 2. Five of the r
> If false, explain briefly. 1. We choose the linear model that passes through the most data points on the scatterplot. 2. The residuals are the observed y-values minus the y-values predicted by the linear model. 3. Least squares means that the square of t
> A study finds that during blizzards, online sales are highly associated with the number of snow plows on the road; the more plows, the more online purchases. The director of an association of online merchants suggests that the organization should encoura
> Most patients who undergo surgery make routine recoveries and are discharged as planned. Others suffer excessive bleeding, infection, or other postsurgical complications and have their discharges from the hospital delayed. Suppose your city has a large h
> A larger firm is considering acquiring the bookstore of Exercise 3. An analyst for the firm, noting the relationship seen in Exercise 3, suggests that when they acquire the store they should hire more people because that will drive higher sales. Is his c
> If we assume that the conditions for correlation are met, which of the following are true? If false, explain briefly. 1. A correlation of 0.02 indicates a strong, positive association. 2. Standardizing the variables will make the correlation 0. 3. Adding
> If we assume that the conditions for correlation are met, which of the following are true? If false, explain briefly. 1. A correlation of 0.98 indicates a strong, negative association. 2. Multiplying every value of x by 2 will double the correlation. 3.
> Disk drives have been getting larger. Their capacity is now often given in terabytes (TB), where 1 TB=1000 gigabytes, or about a trillion bytes. A search of prices for external disk drives on Amazon.com in mid-2016 found the following data: 1. Prepare a
> Consider the following data from a small bookstore: 1. Prepare a scatterplot of Sales against Number of sales people working. 2. What can you say about the direction of the association? 3. What can you say about the form of the relationship? 4. What can
> Suppose you were to collect data for each pair of variables. You want to make a scatterplot. Which variable would you use as the explanatory variable and which as the response variable? Why? What would you expect to see in the scatterplot? Discuss the li
> Suppose you were to collect data for each pair of variables. You want to make a scatterplot. Which variable would you use as the explanatory variable and which as the response variable? Why? What would you expect to see in the scatterplot? Discuss the li
> Environmental Protection Agency (EPA) fuel economy estimates for automobile models tested recently predicted a mean of 24.8 mpg and a standard deviation of 6.2 mpg for highway driving. Assume that a Normal model can be applied. 1. Draw the model for auto
> The shoe size data for women has a mean of 38.46 and a standard deviation of 1.84. To convert to U.S. sizes, use USsize=EuroSize—0.7865−22.5. 1. What is the mean women shoe size for these respondents in U.S. units? 2. What is the standard deviation in
> In Chapter 2 (Exercise 16 ) we saw data on shoe sizes of students, reported in European sizes. For the men, the mean size wasis 44.65 with a standard deviation of 2.03. To convert euro shoe sizes to U.S. sizes for men, use the equation USsize=EuroSize—0.
> In Exercise 8 you were asked to compare the responses of college presidents and all U.S. adults to the question about the value of a college education. To examine that question further, we randomly scrambled the responses and created 15 new mosaic plots
> Suppose you were to collect data for each pair of variables. You want to make a scatterplot. Which variable would you use as the explanatory variable and which as the response variable? Why? What would you expect to see in the scatterplot? Discuss the li
> A company customer service hotline handles many calls relating to orders, refunds, and other issues. The company records indicate that the median length of calls to the hotline is 4.4 minutes with an IQR of 2.3 minutes. 1. If the company were to describe
> A company selling clothing on the Internet reports that the packages it ships have a median weight of 68 ounces and an IQR of 40 ounces. 1. The company plans to include a sales flyer weighing 4 ounces in each package. What will the new median and IQR be?
> An incoming freshman took her college placement exams in French and mathematics. In French, she scored 82 and in math 86. The overall results on the French exam had a mean of 72 and a standard deviation of 8, while the mean math score was 68, with a stan
> A town January high temperatures average 36 with a standard deviation of 10, while in July the mean high temperature is 74 and the standard deviation is 8. In which month is it more unusual to have a day with a high temperature of 55? Explain.
> People with z-scores above 2.5 on an IQ test are sometimes classified as geniuses. If IQ scores have a mean of 100 and a standard deviation of 15 points, what IQ score do you need to be considered a genius?
> The histogram shows the distribution of mean ACT composite scores for all Wisconsin public schools in 2015. 80.1% of the data points fall between one standard deviation below the mean and one standard deviation above the mean. 1. Give two reasons that a
> Corey has 4929 songs in his computer music library. The lengths of the songs have a mean of 242.4 seconds and standard deviation of 114.51 seconds. A Normal probability plot of the song lengths looks like this: 1. Do you think the distribution is Normal?
> The mean household income in the U.S. in 2014 was about $72,641 and the standard deviation was about $85,000. (The median income was $51,939.) If we used the Normal model for these incomes, 1. What would be the household income of the top 1%? 2. How conf
> The Mathematics section of the ACT test had a mean of 20.9 and an SD of 5.3 for the years 2013 2015. If these are well modeled by a Normal distribution, about what percent of students scored 1. over 31? 2. under 18? 3. between 18 and 31?
> Based on the Normal model N(100,15) describing IQ scores, what percent of people IQs would you expect to be 1. over 80? 2. under 90? 3. between 112 and 132?
> In Exercise 5 you were asked whether you thought the differences in political identification across diet preferences were real. To examine that question further, we randomly scrambled the students politics preferences and created 8 new bar charts of thes
> The Virginia Cooperative Extension reports that the mean weight of yearling Angus steers is 1152 pounds. Suppose that weights of all such animals can be described by a Normal model with a standard deviation of 84 pounds. What percent of steers weigh 1. o

