Question: Refer to Exercise 22.4. Set up
Refer to Exercise 22.4. Set up the opportunity loss table.
Data from Exercise 22.4:
Given the following payoff table, draw the decision tree:
Transcribed Image Text:
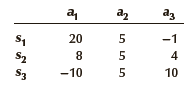
a az az 20 5 -1 8 5 4 S3 -10 5 10
> There appear to be many attractive featuresof government jobs, the most attractive being job security. But is this actually the case? Conduct a test to determine whether government workers (WRKGOVT: 1 = Government, 2 = Private) show a greater preference
> To determine the effect of union membership run a regression with income (RINCOME) as the dependent variable and age (AGE), education (EDUC), number of hours worked per week (HRS1), and union membership (UNION:1 = Respondent belongs, 2 = Spouse belongs,
> Can we infer that there are differences in income (RINCOME) between Americans born in the United States and those born elsewhere (BORN: 1 = United States, 2 = Elsewhere), after removing the effects of age (AGE), education (EDUC), and weekly hours of work
> Conduct a regression analysis with position on the question, should the government help poor people (HELPPOOR: 1 = Government action; 2, 3, 4, 5 = People should help themselves) as the dependent variable and age (AGE), income (RINCOME), education (EDUC),
> Conduct a regression analysis with number of hours of television per day (TVHOURS) to determine whether there is enough evidence to infer that there are differences between the three race categories (RACE: 1 = White, 2 = Black, 3 = Other) after removing
> Can we infer that there are differences in income (RINCOME) between people who work for the government and people who work for private employers (WRKGOVT: 1 = Government, 2 = Private) after removing the effects of age (AGE), education (EDUC), and weekly
> Conduct a regression analysis with position on the question, should the government help poor people? Use (HELPPOOR: 1 = Government action; 2, 3, 4, 5 = People should help themselves) as the dependent variable and age (AGE), education (EDUC), income (RINC
> Can we infer that men and women (SEX: 1 = Male, 2 = Female) differ in the amount of television per day (TVHOURS) after removing the effects of age (AGE) and education (EDUC)?
> Repeat Exercise 18.25 using political views (POLVIEWS3: 1 = Liberal, 2 = Moderate, 3 = Conservative) instead of political party. a. Is there sufficient evidence to infer that liberals are more likely than moderates to believe that government should reduc
> The issue of immigration, legal and illegal, has political and economic ramifications. An important component of the issue is how well immigrants integrate into the American economy. A University of Florida study attempted to answer this question. Resear
> Develop a multiple regression model with the position on the question, should the government reduce income differences (EQWLTH: 1 = Government should reduce income differences; 2, 3, 4, 5, 6, 7 = No government action) as the dependent variable and age (A
> a. Conduct a regression analysis with income (RINCOME) as the dependent variable and age (AGE), education (EDUC), number of hours of work (HRS1), and whether someone worked for him or herself (WRKSLF: 1 = Self, 2 = Someone else) as independent variables.
> Can we infer that men and women (SEX: 1 = Male, 2 = Female) differ in their preference for jobs where there is a chance for advancement?
> Refer to Exercise 19.21. For those who would continue working is it because they consider the work important? Test to determine whether those who would continue working have a higher preference for work they consider important and gives them a feeling of
> What determines people’s opinion on the following question, Should the government improve the standard of living of poor people (HELPPOOR: 1 = Government act; 2, 3, 4, 5 =People should help themselves)? a. Develop a regression analysis using demographic
> The Nielsen Ratings estimate the number of televisions tuned to various channels. However, television executives need more information. The General Social Survey may be the source of this information. Respondents were asked to report the number of hours
> What determines people’s opinion on the following question? Should the government reduce income differences between rich and poor (EQWLTH: 1 = Government should reduce differences; 2, 3, 4, 5, 6, 7 = No government action). a. Develop a regression analysi
> How does the amount of education of one’s parents (PAEDUC, MAEDUC) affect your education (EDUC)? a. Develop a regression model. b. Test the validity of the model. c. Test the two slope coefficients. d. Interpret the coefficients.
> Do men (SEX: 1 = Male, 2 = Female) prefer jobs with higher incomes more than do women? Conduct a statistical test to answer the question.
> Repeat Exercise 16.74 for amount spent on food away from home (FOODAWAY). Data from Exercise 16.74: How much more do households have to spend on food when there are children living at home?
> Why do some students do well in university while others struggle? To help answer this question, a random sample of first-year students at four universities was selected. Those who had a grade point average of more than 3.0 (group 1) and those who had a g
> During the decade of the 1980s, professional baseball thrived in North America. However, in the 1990s attendance dropped, and the number of television viewers also decreased. To examine the popularity of baseball relative to other sports, surveys were pe
> How much more do households have to spend on food when there are children living at home? a. Conduct a test to determine whether there is evidence of a positive linear relationship between total annual amount spent on food at home (FOODHOME) and number o
> It takes many years to build up capital gains. Use a statistical analysis to determine whether there is enough evidence to conclude that as one grows older one increases unrealized capital gains (AGE, KGTOTAL). What is the p-value of the test?
> Another way to interpret the results of Exercise 16.71 is that older people spend less on all food because their families are smaller (children have left home) or that they eat less expensive meals. If so, then we would expect that age (AGE) and amount s
> Are younger middle-class people more likely to eat out at restaurants than older people? Conduct a test to determine whether there is sufficient evidence to infer that age (AGE) and amount spent on food away from home (FOODAWAY) are negatively related?
> It seems obvious that for people who take out student loans more years of education lead to larger student debt. a. Conduct a test to determine whether there is a positive linear relationship between years of education (EDUC) and total value of student l
> An increasing number of people are attending colleges and universities. The effect of this trend is that younger people will be more educated than older people. Conduct a test to determine whether age (AGE) and years of education (EDUC) are negatively li
> Do you need more years of education to get further into debt? This question can be answered by determining the relationship between number of years of education (EDUC) and household debt (DEBT). Undertake a regression analysis to determine the following.
> How does education (EDUC) affect financial success among the heads of middle-class households? Conduct a regression analysis and determine the following. a. Is there evidence of a positive linear relationship between education and total financial assets
> We who educate would like to believe that people who have more education are more likely to do well professionally and financially. Fortunately, we have a number of surveys with real data to confirm our beliefs. Analyze the relationship between years of
> Exercise 13.80 asked whether there is enough evidence to conclude that households whose heads have some college (EDCL: 3 = some college, 4 = college degree) have less debt (DEBT) than households whose heads completed a college degree. a. In order to use
> Refer to A19.5. To acquire information about who is shopping downtown, the statistics practitioner also recorded the annual household income (in $1,000s) of the respondents. Is there enough evidence to infer that affluent people shop downtown more freque
> Refer to Exercise 13.77. a. What is the required condition to apply the t-test of two means to determine whether there is enough evidence to conclude that male heads of households (HHSEX: 1 = Male, 2 = Female) have higher incomes than do female heads of
> Exercise 13.70 asked, “Is there sufficient evidence that middle-class heads of households who work for someone else (OCCAT1: 1 = Someone else, 2 = Self-employed/partnership) have higher incomes that heads of households who are self-employed (INCOME)?” a.
> Refer to Exercise 13.79, which asked whether there is enough evidence to conclude that heads of households with college degrees (EDCL: 3 = some college, 4 = college degree) have more assets than those who have some college (ASSET). a. The appropriate tec
> Repeat Exercise 17.23 for expenditures on food away from home (FOODAWAY).
> How are middle class households’ expenditures on food eaten at home affected by the age, education, and income of the head of the household? To answer the question conduct a regression analysis using FOODHOME as the dependent variable and AGE, EDUC, and
> How does age and education affect income among middle-class households? To answer the question, conduct a regression analysis of the dependent variable INCOME using the independent variables AGE and years of education (EDUC). a. Estimate the regression c
> A number of retailers regularly survey their customers to determine among other things, whether they were happy with their purchase or service and whether they intended to return. A chain of hardware stores/automobile service centers is one such company.
> In addition to analyzing the relationship between the managers’ characteristic and the performance of the fund, researchers wanted to determine whether the same characteristics are related to the behavior of the fund. In particular, they wanted to know w
> There are thousands of mutual funds available (see page 161 for a brief introduction to mutual funds). There is no shortage of sources of information about them. Newspapers regularly report the value of each unit, mutual fund companies and brokers advert
> Ontario high school students must complete a minimum of six Ontario Academic Credits (OACs) to gain admission to a university in the province. Most students take more than six OACs because universities take the average of the best six in deciding which s
> In city after city, downtown cores have become less and less populated and poorer because shoppers have taken their money to the suburbs and to shopping malls. One reason often given for the decline in downtown shops is the difficulty in parking. To shed
> I C16-01 n July 1990, a rock-and-roll museum opened in Atlanta, Georgia. The museum was located in a large city block containing a variety of stores. In late July 1992, a fire that started in one of these stores burned the entire block, including the mus
> The manager of a large shopping center in Buffalo is in the process of deciding on the type of snowclearing service to hire for his parking lot. Two services are available. The White Christmas Company will clear all snowfalls for a flat fee of $40,000 fo
> Refer to Exercise 22.7. Assume that the probability of each value of demand is the same for all possible demands. a. Determine the EMV decision. b. Determine the EOL decision. Data from Exercise 22.7: A baker must decide how many specialty cakes to bake
> A baker must decide how many specialty cakes to bake each morning. From past experience, she knows that the daily demand for cakes ranges from 0 to 3. Each cake costs $3.00 to produce and sells for $8.00, and any unsold cakes are thrown into the garbage
> If we assign the following probabilities to the states of nature in Exercise 22.5, determine the EOL decision: P(s1) = .2 P(s2) = .6 P(s3) = .2
> A major movie studio has just completed its latest epic, a musical comedy about the life of Attila the Hun. Because the movie is different (no sex or violence), the studio is uncertain about how to distribute it. The studio executives must decide whether
> The Megabuck Computer Company is thinking of introducing two new products. The first, Model 101, is a small computer designed specifically for children between ages 8 and 16. The second, Model 202, is a medium-size computer suitable for managers. Because
> Max the Bookie is trying to decide how many telephones to install in his new bookmaking operation. Because of heavy police activity, he cannot increase or decrease the number of telephones once he sets up his operation. He has narrowed the possible choic
> Suppose that in Exercise 22.39 a sample of size 5 showed that only one person believes the new ad. In light of this additional information, what should the manager do?
> In an effort to analyze the results of Exercise A15.9, the researcher recorded the total travel length of the course. This variable measures the total distance golfers must walk to play a round of golf. It is the sum of the golf-course playing distance p
> Suppose that in Exercise 22.39 it is possible to perform a survey to determine the percentage of people who believe the ad. What would a sample of size 1 be worth?
> Given the following payoff table, draw the decision tree: a az az 20 5 -1 8 5 4 S3 -10 5 10
> Credibility is often the most effective feature of an advertising campaign. Suppose that, for a particular advertisement, 32% of people surveyed currently believe what the ad claims. A marketing manager believes that for each 1-point increase in that per
> The president of an automobile battery company must decide which one of three new types of batteries to produce. The fixed and variable costs of each battery are shown in the accompanying table. The president believes that demand will be 50,000, 100,000
> Suppose that in Exercise 22.32 a random sample of 25 radio listeners revealed that 2 people would be regular listeners of the station. What is the optimal decision now?
> In Exercise 22.32, suppose that it is possible to survey radio listeners to determine whether they would tune in to the station if the format changed to rock and roll. What would a survey of size 2 be worth?
> Suppose that in Exercise 22.14 a consultant offers to analyze the problem and predict the amount of electricity required by the new community. To induce the electric company to hire her, the consultant provides the set of likelihood probabilities given h
> Repeat Exercise 22.33, given that 12 out of 100 households respond affirmatively.
> There is a garbage crisis in North America—too much garbage and no place to put it. As a consequence, the idea of recycling has become quite popular. A waste-management company in a large city is willing to begin recycling newspapers, aluminum cans, and
> A radio station that currently directs its programming toward middle-age listeners is contemplating switching to rock-and-roll music. After analyzing advertising revenues and operating costs, the owner concludes that, for each percentage point of market
> Refer to Exercise 13.36 where respondents were asked to taste the same wine in two different bottles. The first bottle was capped using a cork, and the second had a metal screw cap. Respondents were also asked to taste the wine and rate it using the foll
> To improve her decision-making capability, the electronics products manufacturer in Exercise 22.16 performs a survey of potential buyers of compact disc players. She describes the product to 25 individuals, 3 of whom say they would buy it. Using this add
> What is the maximum price the electronics productmanufacturer should be willing to pay for perfect information regarding the market share in Exercise 22.16?
> If we assign the following probabilities to the states of nature in Exercise 22.1, determine the EMV decision: P(s1) = .4 P(s2) = .1 P(s3) = .3 P(s4) = .2
> A sporting-goods storeowner has the opportunity to purchase a lot of 50,000 footballs for $100,000. He believes that he can sell some or all by taking out mail-order advertisements in a magazine. Each football will be sold for $6. The advertising cost is
> What conclusions can you draw about the effect of the prior probabilities on EVSI from Exercises 22.25–22.27?
> Repeat Exercise 22.25 with the following prior probabilities. P(s1) = .90 P(s2) = .05 P(s3) = .05
> Repeat Exercise 22.25 with the following prior probabilities. P(s1) = .5 P(s2) = .4 P(s3) = .1
> Given the following payoff table, prior probabilities, and likelihood probabilities, find the expected value of sample information. Payoff Table Prior probabilities Likelihood Probabilities
> With the accompanying payoff table and the prior and posterior probabilities computed in Exercise 22.23 calculate the following. a. The optimal act for each experimental outcome b. The expected value of sample information Payoff Table a, az az 10 18
> Calculate the posterior probabilities from the prior and likelihood probabilities that follow. Prior Probabilities P(s1) = .5 P(s2) = .5 Likelihood Probabilities .98 .02 S2 .05 .95
> Some customers spend a great deal of time doing research before choosing a particular brand of a product, particularly an expensive product. Does this result in a more satisfied customer? To shed light on this question, a random sample of people who purc
> Determine the posterior probabilities, given the following prior and likelihood probabilities. Prior probabilities P(s1) = .25 P(s2) = .40 P(s3) = .35 Likelihood Probabilities .20 .10 .25 .25 S3 .40 .30
> What conclusion can you draw about the effect of the probabilities on EVPI from Exercises 22.19 and 22.20?
> Redo Exercise 22.19, changing the probabilities to the following values. a. P(s1) = .75 P(s2) = .25 b. P(s1) = .95 P(s2) = .05
> Draw the decision tree for Exercise 22.1.
> Given the following payoff table and probabilities, determine EVPI. P(s1) = .5 P(s2) = .5 az a a4 65 20 45 30 S2 70 110 80 95
> For Exercise 22.17, determine the opportunity loss table and compute EOL*. Confirm that EOL* = EVPI.
> Find EPPI, EMV*, and EVPI for the accompanying payoff table and probabilities. P(s1) = .10 P(s2) = .25 P(s3) = .50 P(s4) = .15 a, az 60 110 75 40 110 150 S2 220 120 85 SA 250 120 130
> An international manufacturer of electronic products is contemplating introducing a new type of compact disk player. After some analysis of the market, the president of the company concludes that, within 2 years, the new product will have a market share
> A retailer buys bushels of mushrooms for $2 each and sells them for $5 each. The quality of the mushrooms begins to decline after the first day they are offered for sale; therefore, to sell the mushrooms for $5/bushel, he must sell them on the first day.
> The electric company is in the process of building a new power plant. There is some uncertainty regarding the size of the plant to be built. If the community that the plant will service attracts a large number of industries, the demand for electricity wi
> Most supermarkets load groceries into plastic bags. However, plastic bags take many years to decompose in garbage dumps. To determine how big the problem might be, a random sample of American households was each asked to determine the number of plastic
> A building contractor must decide how many mountain cabins to build in the ski resort area of Chickoh- pee. He builds each cabin at a cost of $26,000 and sells each for $33,000. All cabins unsold after 10 months will be sold to a local investor for $20,0
> Refer to Exercise 22.11. The owner has assignedthe following probabilities: P(Demand = 100) = .2, P(Demand = 150) = .25, P(Demand = 200) = .40, P(Demand = 250) = .15 Find the EMV decision.
> The owner of a clothing store must decide how many men’s shirts to order for the new season. For a particular type of shirt, she must order in quantities of 100 shirts. If she orders 100 shirts, her cost is $10 per shirt; if she orders 200 shirts, her co
> Refer to Exercise 22.9. Using subjective assessments the manager has assigned the following probabilities to the number of snowfalls. Determine the optimal decision. P(0) = .05 P(1) = .15 P(2) = .30 P(3) = .40 P(4) = .10 Data from Exercise 22.9: The
> Set up the opportunity loss table from the following payoff table: az 55 26 S2 43 38 29 43 S3 SA 15 51
> On average, how many units will be produced until the control chart signals that the process is out of control when it is under control?
> Refer to Exercise 21.7. Determine the ARL until the x chart signals that the process is out of control when it is under control. Data from Exercise 21.7: The control limits of an x chart are set at two standard errors from the centerline. Calculate the
> The control limits of an x chart are set at two standard errors from the centerline. Calculate the probability that on any sample the control chart will indicate that the process is out of control when it is under control.
> Refer to Exercise 21.5. What is the average run length until the x chart signals that the process is out of control when it is under control? Data from Exercise 21.5: If the control limits of an x chart are set at 2.5 standard errors from the centerline
> If the control limits of an x chart are set at 2.5 standard errors from the centerline, what is the probability that on any sample the control chart will indicate that the process is out of control when it is under control?
> In 2003, there were 129,142,000 workers in the United States The general manager for a public transportation company wanted to learn more about how workers commute to work and how long it takes them. A random sample of workers was interviewed. Each repor
> A courier delivery company advertises that it guarantees delivery by noon the following day. The statistical process control plan calls for sampling 2,000 deliveries each day to ensure that the advertisement is reasonable. The number of late deliveries f
> A company that manufactures batteries employs statistical process control to ensure that its product functions properly. The sampling plan for the D-cell batteries calls for samples of 500 batteries to be taken and tested. The numbers of defective batter

