Question: Target Corp. operates “big box” stores that
Target Corp. operates “big box†stores that sell everyday essentials and fashionable differentiated merchandise. It also operates an online business at target.com. Target’s reported gross earnings per share for the years 2003–2006 are given here.
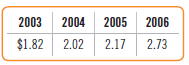
a) Find a prediction for 2007 based on a 3-year moving average and one for a 4-year moving average.
b) Find a prediction for 2007 based on an exponential smoothing model with a = 0.8.
c) Earnings per share in 2007 were, in fact, $3.18. Compute the absolute percentage error for each prediction.
> Are the following data time series? If not, explain why. a) Reports from the Bureau of Labor Statistics on the number of U.S. adults who are employed full-time in each major sector of the economy. b) The quarterly Gross Domestic Product (GDP) of France f
> Are the following data time series? If not, explain why. a) Quarterly earnings of Microsoft Corp. b) Unemployment in August 2010 by Education level. c) Time spent in training by workers in NewCo. d) Numbers of e-mails sent by employees of SynCo each hour
> Fred Barolo heads a travel company that offers, among other services, customized travel packages. These packages provide a relatively high profit margin for his company, but Fred worries that a weakened economic outlook will adversely affect this segment
> Alpine Medical Systems, Inc., is a large provider of medical equipment and supplies to hospitals, doctors, clinics, and other health care professionals. Alpine’s VP of Marketing and Sales, Kenneth Jadik, asked one of the company’s analysts, Nicole Haly,
> Most people older than 40 remember chia seeds as the source of “green hair” for a variety of animal-shaped terra-cotta figurines. While chia pets are still available (there is even one resembling President Trump), chia seeds are now more often recognized
> GoLearn is a new social networking site designed mainly for college students who have an interest in study abroad. Students from both within and outside the United States are beginning to join, although the majority of users are from the United States. U
> A concert production company examined its records. The manager made the following scatterplot. The company places concerts in two venues, a smaller, more intimate theater (plotted with blue circles) and a larger auditorium-style venue. a) Describe the
> Here are data on the monthly price of Delicious apples and gas, which are both components of the Consumer Price Index. The timeplot shows the years 2006–2009 for apples; the data table shows just 2006, for both. For the Apple prices:
> Life insurance rates are based on life expectancy values compiled for large demographic groups. But with improvements in medical care and nutrition, life expectancies have been changing. Here is a table from the National Vital Statistics Report that give
> Many professions use tables to determine key quantities. The value of a log is based on the number of board feet of lumber the log may contain. (A board foot is the equivalent of a piece of wood 1 inch thick, 12 inches wide, and 1 foot long. For example,
> Consider again the post-1960 trend in U.S. GDP we examined in Exercise 57. Here are a regression and residual plot when we use the square root of GDP in the model. Is this a better model for GDP? Explain. Response variable is: VGDP R squared = 99.4%
> The scatterplot shows the gross domestic product (GDP) of the United States in trillions of (2010) dollars plotted against years since 1960. (Data in GDP and DJIA 2017) A linear model fit to the relationship looks like this: (We’ve i
> Of course, what matters most to the individual entrepreneur—the licensed commercial lobster fisher—is the price of lobster. Here’s an analysis relating that price ($/lb) to the number of traps (millio
> Does the Dow Jones Industrial Average (DJIA) reflect the economy as measured by the Gross Domestic Product (GDP)? Here’s a plot and a regression. (Both are converted to 2010 dollars to remove the effects of inflation. GDP is in $B to ma
> Lobster are caught in traps, which are baited and left in the open ocean. Licenses to fish for lobster are limited, there is a small additional fee for each trap in use, and there are limits on the numbers of traps that can be placed in each of seven fis
> According to the Maine Department of Marine Resources, in 2016 more than 130,800,000 pounds of lobster were landed in Maine—a catch worth more than $533.09M. The lobster fishing industry is carefully controlled and licensed, and facts a
> In Exercise 40, we fit a linear regression for the number of monthly international visitors to Hawaii (for the years 2002 through 2006) using Time and dummy variables for the months as predictors. The R2 value was 59.9% and a residual plot against Time
> In Exercise 39, we fit a linear regression for the number of monthly domestic visitors to Hawaii (for the years 2002 through 2006) using Time and dummy variables for the months as predictors. The R2 value was 96.6% and a residual plot against Time would
> The data for hard drives in Exercise 6 originally included a 200 GB (0.2 TB) drive that sold for $299.00 (see Chapter 4, Exercise 2). a) Find the regression line predicting Price from Capacity with this hard drive added. b) What has changed from the orig
> In Exercise 39, we fit a linear regression for the number of monthly domestic visitors to Hawaii (for the years 2002 through 2006) using Time and dummy variables for the months as predictors. The R2 value was 96.6% and a residual plot against Time would
> The following time series plot shows the data for the monthly U.S. Unemployment rate (%) from January 2003 to June 2013. These data have been seasonally adjusted (meaning that the seasonal component has already been removed). a) What time series compon
> Return to the oil price data of Exercise 47. a) Find a linear model for this series. b) Find an exponential (multiplicative) model for this series. c) For the model of Exercise 47 and the models of parts a and b, compute the MAPE. Which model did best? G
> A time series plot of monthly crude oil price ($/barrel) from January 2001 to March 2007 is shown here. Using these data, a) Fit a first-order autoregressive model. b) Obtain a forecast for March 2007. 70+ A 60+ 50+ 40+ 30 20+ 10 Month Jan Jan Jan
> Using the data from Exercise 42, develop and compare the following models. a) Fit an appropriate autoregressive model by testing for the significance of each autoregressive term. b) Obtain a forecast for the week of May 28, 2007. c) Compare your forecast
> a) Fit a linear trend model with dummy variables for the seasonal effect to the e-commerce data in Exercise 44. b) Fit an exponential trend (multiplicative) model with dummy variables to these data. c) Which model fits better? Exercise 44: Quarterly e-c
> Quarterly e-commerce retail sales (in millions of dollars) in the United States are provided. (Source: U.S. Census Bureau; www.census.gov.) Use this time series to answer the following questions. a) Fit a linear trend model to this series but do not use
> The plot of residuals in Exercise 41 shows large fluctuations starting in 2006 and an earlier outlier that wasn’t as evident in the data. The outlier is September 2001. This wasn’t a typical month for air travel becaus
> We have seen that gas prices can fluctuate. But during some periods they have moved consistently. Here are the data extracted for one week of each month from January 2002 to May 2007. The bend in the plot and the increasing variation suggest a multipl
> The Port of Oakland airport reports the number of passengers passing through each month. The time series plot shows fluctuations that may relate to the economy. By recognizing the series as a time series, we may learn more. Here is an additive model th
> An analysis of spending by a sample of credit card bank cardholders shows that spending by cardholders in January ( Jan) is related to their spending in December (Dec): The assumptions and conditions of the linear regression seemed to be satisfied and
> In Exercise 39 we examined domestic tourists who visit Hawaii. Now, let’s consider international tourism. Here’s a time series plot of international visitors for the same time period. Here’s the lin
> Much of the public and private industry in Hawaii depends on tourism. The following time series plot shows the number of domestic visitors to Hawaii by air from the rest of the United States per month from January 2002 through December 2006 before the fi
> The movie Harry Potter and the Sorcerer’s Stone opened as a great success. But every movie sees declining revenue over time. Here are the daily revenues for the movie during its first 17 days. a) Without plotting the data, what componen
> Walmart grew rapidly in the years leading up to the financial crisis. Here is the monthly revenue ($Billion) for Walmart from November 2003 to January 2007. a) What components of a time series do you see in this timeplot? Here’s a reg
> Use the following model to forecast quarterly sales ($000) for a start-up (where time is rescaled to begin at zero and Q2, Q3, and Q4 are dummy variables for the indicated quarters), and answer the following questions. a) For the first quarter of the t
> Use the following model to forecast quarterly sales ($Million) for a company (where time is rescaled to begin at zero and Q2, Q3, and Q4 are dummy variables for the indicated quarters), and answer the following questions. a) For the first quarter of th
> Average annual interest rates (banks prime lending) in the United States from 1966 through 2009 are shown in the following time series graph. a) What components do you see in this series? Here’s an autoregressive model with a 13-week
> In Exercise 30 we looked at the weekly average retail price (cents per gallon) of regular gas nationwide from 2011 through June 2013. Here’s the time series plot again: a) What components can you see in this plot? Hereâ€
> The most common use of the Consumer Price Index (CPI) is as an economic indicator to forecast inflation and evaluate the effectiveness of government policies. Following is the time series plot for the monthly CPI (not seasonally adjusted) from January 20
> The Gallup organization periodically asks the following question: If your party nominated a generally well-qualified person for president who happened to be a woman, would you vote for that person? Here is a time series plot of the percentage answering &
> For the regression in Exercise 19: A student tries taking the reciprocal of customers and produces the plot shown below: a) Would you recommend this transformation? Why or why not? b) What would you suggest?
> We have data on the weekly average retail price (cents per gallon) of regular gas nationwide. We’ll extract the data from 2011 through June 2013. Here’s a time series plot. Here are a 4-point moving average and a 3-t
> Coffee is the world’s second largest legal export commodity (after oil) and is the second largest source of foreign exchange for developing nations. The United States consumes about one-fifth of the world’s coffee. The
> Suppose an autoregressive model is used to model sales for a company that peaks twice per year (in June and December). a) What lagged variables would you try in a regression to forecast sales? Explain. b) How would you determine which of your lagged vari
> Suppose an autoregressive model is used for data in which quarterly sales in 201 were: 1.9, 1.7, 2.2, and 2.3 ($Billion). a) If a first-order autoregressive model is developed with estimated parameters of b0 = 0.100 and b1 = 1.12, compute the forecast fo
> The following graph shows the quarterly median weekly earnings for U.S. women 25 years of age or older (U.S. Bureau of Labor Statistics; www.bls.gov). Data are provided from the first quarter of 2003 through the first quarter of 2013. Here is single ex
> This graph shows the quarterly median weekly earnings from the first quarter of 2003 through the first quarter of 2013 for men, 25 years of age or older, in the United States (U.S. Bureau of Labor Statistics; www.bls.gov). Here are time series plots sh
> The following time series graph shows daily closing stock prices (adjusted for splits and dividends) for Google, Inc., from January 1, 2008, through June 21, 2013 (Source: Yahoo! Finance). a) Which time series components are evident? Single exponential
> The following time series graph shows daily closing stock prices for Toyota Motor Manufacturing from April 1, 2008, through June 21, 2013 (Source: Yahoo! Finance). a) Which time series components seem to be present? The method of moving averages was ap
> The price of bananas fluctuates on the world market. Here are the prices ($/tonne) for the years 2000–2004 (Source: Holy See Country Review, 2008). a) Find a 3-year moving average prediction for the price in 2005. b) Find a prediction
> A quickly growing company shows the following scatterplot of customers vs. time (in months). a) What re-expression might you suggest for the number of customers? b) What power in the ladder of powers does that correspond to?
> Sara Lee Corp., maker of food, beverage, and household products, is known especially for its baked products, marketed under its corporate name. For the five years ending July 1 of each year from 2002 to 2006, their bakery division reported the following
> The Bank of New York Company was founded by Alexander Hamilton in 1784 and was a major commercial bank until its merger with the Mellon Financial Corporation in 2007. Their year-end financial reports for the final five years of independent operation give
> For each of the following time series, suggest an appropriate model: a) Daily stock prices that reveal erratic periods of up and down swings. b) Monthly sales that reveal a consistent percentage increase from month to month. c) Quarterly sales for a woma
> For each of the following time series, suggest an appropriate model: a) Weekly stock prices that reveal erratic periods of up and down swings. b) Annual sales that reveal a consistent percentage annual increase. c) Quarterly sales for a bicycle shop that
> We are trying to forecast monthly sales for a company that sells ski equipment and clothing. Assume that the company’s sales peak each December and that the monthly sales have been growing at the rate of 1% each month. Answer the following questions. a)
> a) Which will be smoother, a 50-day or a 200-day moving average? b) Which will be smoother, a single exponential smoothing (SES) model using a = 0.10 or a model using a = 0.80? c) What is the difference in how historical data are used when the smoothing
> Here’s a multiple regression model for the variables considered in Exercise 12: a) Write the regression model. b) What does the coefficient of Attendance mean in this regression? c) In a season in which attendance was 13 million over
> Here’s a multiple regression model for the variables considered in Exercise 11. a) Write the regression model. b) What does the coefficient of Police Pay mean in the context of this regression model? c) In a state in which the average
> In 2016, 13.27 million people attended a Broadway show, paying an average of more than $100 per ticket. We’d like to understand this $1.4 million business better. The Broadway League, Inc. (www .broadwayleague.com/research/statistics-broadway-nyc/), prov
> Is the amount of violent crime related to what police officers are paid? The data file holds data for each state of the United States. The variables are: Violent Crime (crimes per 100,000 population) Police Officer Pay (mean $) High School Graduation Ra
> One possible model for the manufacturing process of Exercise 17 is the following: Using this model, predict the cost per unit in a batch of 300.
> Professional sports, like many other professions, require a variety of skills for success. That makes it difficult to evaluate and predict success. Fortunately, sports provide examples we can use to learn about modeling success because of the vast amount
> The gross domestic product (GDP) per capita is a widely used measure of a country’s (or state’s) economy. It is defined as the total market value of all goods and services produced within a country (or state) in a specified period of time. The most commo
> Tiffany was founded in 1837, when Charles Lewis Tiffany opened his first store in downtown Manhattan. Tiffany retails and distributes a selection of Tiffany & Co. brand jewelry at a range of prices. Today, more than 150 Tiffany & Co. stores sell
> How has trade between the United States and the European Union developed? The file EU Imports contains U.S. imports($M) from the European Union countries from 1997 to 2012. (Source: Download from the bottom of www.census .gov/foreign-trade/balance/c5700.
> Renewable sources of energy are of growing importance in the economy. The Energy Information Administration reports the amount of renewable energy generated (in thousands of kilowatt-hours) in each of the states both including and excluding hydroelectric
> The Paralyzed Veterans of America (PVA) is a philanthropic organization sanctioned by the U.S. government to represent the interests of those veterans who are disabled. (For more information on the PVA see the opening of Chapter 21.) To generate donation
> Find the predicted value of y, using each model when x = 4.
> Find the predicted value of y, using each model for x = 10.
> For each of the models listed below, predict y when x = 2.
> For each of the models listed below, predict y when x = 2.
> A small company has developed an improved process for making solar panels. The company needs to set its prices and wants those prices to reflect the efficiencies of producing larger batches. The data show the following: A scatterplot of Cost per Unit v
> The home retail industry experienced relatively consistent annual growth until the economic crisis of 2006. Here is a scatterplot of the Net Sales ($B) of The Home Depot from 1995 through 2004, along with a regression and a time series plot of the residu
> In Exercise 29, we created a linear model describing the trend in the number of passengers departing from Oakland (CA) airport each month from 1997 to 2007. Here’s the residual plot, but with lines added to show the order of the values
> Can the amount of money that a country spends on health (as % of GDP) be predicted by other economic indicators? Here’s a regression predicting Expenditures on Public Health (as % of GDP) from Expected Years of Schooling and Internet Us
> Like many fast-food restaurant chains, Burger King (BK) provides data on the nutrition content of its menu items on its website. Here’s a multiple regression predicting calories for Burger King foods from Protein content (g), Total Fat
> The dataset holds various measures of the 50 United States. The Murder rate is per 100,000, HS Graduation rate is in %, Income is per capita income in dollars, Illiteracy rate is per 1000, and Life Expectancy is in years. Find a regression model for Life
> Here’s another model for the MSRP of off-road motorcycles. a) Would this be a good model to use to predict the price of an off-road motorcycle if you knew its bore, clearance, and engine strokes? Explain. b) The Honda CRF450X has an M
> In Exercise 41, we saw data on off-road motorcycles and examined scatterplots. Review those scatterplots. Here’s a regression of MSRP on both Displacement and Bore. Both of the predictors are measures of the size of the engine. The displacement is the to
> More than one million motorcycles are sold annually (www.webbikeworld.com). Off-road motorcycles (often called “dirt bikes”) are a market segment (about 18%) that is highly specialized and offers great variation in fea
> Are there fundamental differences between liberal arts colleges and universities? In this case, we have information on the top 25 liberal arts colleges and the top 25 universities in the United States. We will consider the type of school as our response
> An important challenge in clinical trials is patients who drop out before the trial is completed. This can cost pharmaceutical companies millions of dollars because patients who have received a tested treatment for months must be combined with those who
> A regression model from the collection of houses in Exercise 15 shows the following: a) The slope of Age is negative. Does this indicate that older houses cost less, on average? Explain. b) Why did the model subtract 38.5122 from Age in the quadratic t
> Consider the model you fit in Exercise 37 to predict Walmart’s revenue from the Retail Index, CPI, and Personal Consumption index. a) Plot the residuals against the predicted values and comment on what you see. b) Identify and remove the four cases corre
> Walmart is the second largest retailer in the world. The data file on the disk holds monthly data on Walmart’s revenue, along with several possibly related economic variables. a) Using computer software, find the regression equation predicting Walmart re
> In Exercise 35 you identified several countries that had potentially large inf luence on the model in Chapter 18, Exercise 36, predicting HDI. Set those countries aside and rerun the model. Write up a few sentences on the impact that leaving these countr
> In Chapter 18, Exercise 36 we found a model for HDI (the UN’s Human Development Index) from Life expectancy, schooling, mean years of school, and log(GNI/capita) for 188 countries. Using software that provides regression diagnostics (leverage values, Coo
> In Exercise 33 we saw that there were several potential high inf luence points. After a researcher set aside those four countries, she refit the model in Exercise 33. A plot of residuals vs. predicted values showed: a) What assumption and/or condition
> In Chapter 18, Exercise 33 we found a model for GDP per Capita from three country characteristics: Cell phones/100 people, Internet Users/100 people, and Primary Completion Rate. A look at leverage values and Cook’s Distance identifies
> The model in Exercise 30 is missing one predictor that we might have expected to see. Engine Displacement is highly correlated 1r = 0.7832 with MSRP, but that variable has not entered the model (and, indeed, would have a P-value of 0.54 if it were added
> In Exercise 8 we found a model for the gross revenue from U.S. movie theatres for 106 recent movies that were rated either R or PG-13. A plot of residuals against predicted revenue shows: A histogram of the y-variable, US Gross, shows: a) What assump
> Off-road motorcycles (often called “dirt bikes”) are a segment (about 18%) of the growing motorcycle market. Because dirt bikes offer great variation in features, they are a good market segment to study to learn about
> In Chapter 18, Exercise 46 we found a model for national Health Expenditures from an economic variable, Internet Users/100 people, and Primary Completion Rate. A look at leverage values and Cook’s Distances identifies several countries
> A collection of houses in a neighborhood of Boston shows the following relationship between Price and Age of the house: a) Describe the relationship between Price and Age. Explain what this says in terms of house prices. b) A linear regression of Price
> For the first model considered in Exercise 27, with all four predictors in the model, a plot of Leverage values shows the two largest values are San Francisco, USA (0.094), and Hamilton, Bermuda (0.077). a) By examining the values of their predictor va
> The Brief Case in Chapter 4 introduced the Cost of Living dataset that contains an estimate of the cost of living for 511 cities worldwide in 2017. In addition to the overall Cost of Living Index are: the Rent Index, Groceries Index, Restaurant Index, an
> Breakfast cereal manufacturers publish nutrition information on each box of their product. As we saw in Chapter 17, there is a long history of cereals being associated with nutrition. Here’s a regression to predict the number of Calorie
> Insurance companies base their premiums on many factors, but basically all the factors are variables that predict life expectancy. Life expectancy varies from state to state. Here’s a regression that models Life Expectancy in terms of o
> Here’s a plot of the studentized residuals from the regression model of Exercise 18 plotted against ArterialMPH. The plot is colored according to City Size (Small, Medium, Large, and Very Large), and regression lines are fit for each ci

