Question: The following data represent the distribution of
The following data represent the distribution of birth weights (in grams) for babies in which the pregnancy went full term (37–41 weeks).
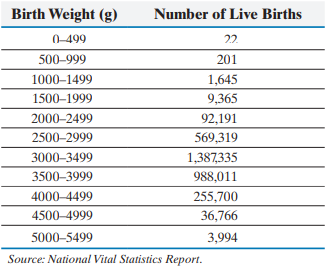
(a) Construct a relative frequency distribution for birth weight.
(b) Draw a relative frequency histogram for birth weight. Describe the shape of the distribution.
(c) Determine the mean and standard deviation birth weight.
(d) Use the normal model to determine the proportion of babies in each class.
(e) Compare the proportions predicted by the normal model to the relative frequencies found in part (a). Do you believe that the normal model is effective in describing the birth weights of babies?
> According to the Current Population Survey (Internet release date: September 15, 2004), 55% of males between the ages of 18 and 24 years lived at home in 2003. (Unmarried college students living in a dorm are counted as living at home.) Suppose a survey
> According to a study done by Nick Wilson of Otago University Wellington, the probability a randomly selected individual will not cover his or her mouth when sneezing is 0.267. Suppose you sit on a bench in a mall and observe 300 randomly selected individ
> In the Healthy Handwashing Survey conducted by Bradley Corporation, it was found that 64% of adult Americans operate the flusher of toilets in public restrooms with their foot. Suppose you survey a random sample of 740 adult American women aged 18–24 yea
> In a recent poll, the Gallup Organization found that 45% of adult Americans believe that the overall state of moral values in the United States is poor. Suppose a survey of a random sample of 500 adult Americans is conducted in which they are asked to di
> According to American Airlines, Flight 215 from Orlando to Los Angeles is on time 90% of the time. Randomly select 150 flights and use the normal approximation to the binomial to (a) approximate the probability that exactly 130 flights are on time. (b) a
> n = 85, p = 0.8, x = 70
> n = 75, p = 0.75, x = 60
> n = 100, p = 0.05, x = 50
> n = 40, p = 0.25, x = 30
> A survey regarding download time on a certain website is administered on the Internet by a market research firm to anyone who would like to take it.
> n = 80, p = 0.15, x = 18
> n = 60, p = 0.4, x = 20
> The probability that fewer than 35 people support the privatization of Social Security
> The probability that no more than 500 adult Americans support a bill proposing to extend daylight savings time
> The probability that fewer than 40 households have a pet
> The probability that more than 20 people want to see the marriage tax penalty abolished
> The probability that the number of tornadoes that occur in the month of May is between 30 and 40, inclusive
> The probability that the number of people with blood type O-negative is between 18 and 24, inclusive
> The probability that exactly 12 students pass the course
> The probability that exactly eight defective parts are in the shipment
> A college official divides the student population into five classes: freshman, sophomore, junior, senior, and graduate student. The official takes a simple random sample from each class and asks the members’ opinions regarding student services.
> The probability no more than 20 people want to see Roe v. Wade overturned
> The probability that at least 40 households have a gas stove
> Suppose X is a binomial random variable. To approximate /
>
>
>
> True or False: A normal score is the expected z-score of a data value, assuming the distribution of the random variable is normal.
> A_____ ____ ______ is a graph that plots observed data versus normal scores.
> Retrieve the data 7_3_13 at www.pearsonhighered.com/sullivanstats using the file format of your choice for the text you are using. The data represent the time spent waiting in line (in minutes) for the Dinosaur Ride at Walt Disney World for 100 randomly
> A random sample of college students aged 18–24 years was obtained, and the number of hours of television watched in a typical week was recorded. (a) Draw a normal probability plot to determine if the data could have come from a normal distribution. (b) D
> A farmer divides his orchard into 50 subsections, randomly selects 4, and samples all the trees within the 4 subsections to approximate the yield of his orchard.
> In a 1998 advertising campaign, Nabisco claimed that every 18-ounce bag of Chips Ahoy! cookies contained at least 1000 chocolate chips. Brad Warner and Jim Rutledge tried to verify the claim. The following data represent the number of chips in an 18-ounc
> A random sample of 25 years between 1890 and 2018 was obtained, and the amount of snowfall, in inches, for Memphis was recorded.
> A random sample of 20 undergraduate students receiving student loans was obtained, and the amount of their loans for the 2018–2019 school year was recorded.
> A random sample of weekly work logs at an automobile repair station was obtained, and the average number of customers per day was recorded.
> A random sample of O-rings was obtained, and the wall thickness (in inches) of each was recorded.
>
> Determine the area under the standard normal curve that lies to the left of (a) z = -2.45 (b) z = -0.43 (c) z = 1.35 (d) z = 3.49
> If X is normal random variable with mean 40 and standard deviation 10 and P(X < 38) = 0.4207, then P(X ≤ 38) =____.
> If X is a normal random variable with mean 40 and standard deviation 10 and P(X >45) = 0.3085, then P(X < 35) =_____.
> The notation za is the z-score such that the area under the standard normal curve to the right of za is______.
> A radio station asks its listeners to call in their opinion regarding the use of U.S. forces in peacekeeping missions.
> A random variable Z that is normally distributed with mean = 0 and standard deviation = 1 is said to have the _____ ______.
> The ACT and SAT are two college entrance exams. The composite score on the ACT is approximately normally distributed with mean 21.1 and standard deviation 5.1. The composite score on the SAT is approximately normally distributed with mean 1026 and standa
> Explain why P(X ≤220) should be reported as > 0.9999 if X is a normal random variable with mean 100 and standard deviation 15.
> Explain why P(X < 30) should be reported as
> Give three interpretations for the area under a normal curve.
> The file 7_2_53 represents distance (in feet) of all home runs hit during the 2018 Major League baseball season. It is available at www.pearsonhighered.com/sullivanstats. (a) Draw a relative frequency histogram of the home run distances using a lower cla
> The time required for Speedy Lube to complete an oil change service on an automobile approximately follows a normal distribution, with a mean of 17 minutes and a standard deviation of 2.5 minutes. (a) Speedy Lube guarantees customers that the service wil
> Fast-food restaurants spend quite a bit of time studying the amount of time cars spend in their drive-thru. Certainly, the faster the cars get through the drive-thru, the more the opportunity for making money. QSR Magazine studied drive-thru times for fa
> The number of chocolate chips in an 18-ounce bag of Chips Ahoy! chocolate chip cookies is approximately normally distributed, with a mean of 1262 chips and a standard deviation of 118 chips, according to a study by cadets of the U.S. Air Force Academy. S
> In an effort to identify whether an advertising campaign has been effective, a marketing firm conducts a nationwide poll by randomly selecting individuals from a list of known users of the product.
> The reading speed of sixth-grade students is approximately normal, with a mean speed of 125 words per minute and a standard deviation of 24 words per minute. (a) What is the reading speed of a sixth-grader whose reading speed is at the 90th percentile? (
> The mean incubation time of fertilized chicken eggs kept at 100.5°F in a still-air incubator is 21 days. Suppose that the incubation times are approximately normally distributed with a standard deviation of 1 day. Source: University of Illinois Extension
> See Problem 45. In games where a team is favored by more than 12 points, the margin of victory for the favored team relative to the spread is normally distributed with a mean of -1.0 point and a standard deviation of 10.9 points. Source: Justin Wolfers,
> In sports betting, Las Vegas sports books establish winning margins for a team that is favored to win a game. An individual can place a wager on the game and will win if the team bet upon wins after accounting for the spread. For example, if Team A is fa
> Ball bearings are manufactured with a mean diameter of 5 millimeters (mm). Because of variability in the manufacturing process, the diameters of the ball bearings are approximately normally distributed, with a standard deviation of 0.02 mm. (a) What prop
> Steel rods are manufactured with a mean length of 25 centimeters (cm). Because of variability in the manufacturing process, the lengths of the rods are approximately normally distributed, with a standard deviation of 0.07 cm. (a) What proportion of rods
> Using a technique referred to as the “Hi-Opt I System” in the casino game blackjack, a player can expect to earn $1.65 per shoe of cards with a standard deviation of $48.93 with a $1 bet per hand. The earnings are approximately normally distributed. This
> The lengths of human pregnancies are approximately normally distributed, with mean = 266 days and standard deviation = 16 days. (a) What proportion of pregnancies lasts more than 270 days? (b) What proportion of pregnancies lasts less than 250 days?
> The ability to determine the age of some individuals can be difficult if there are not quality government records of birth. Bone growth takes place at the growth plates at the end of long bones. Once all growth plates fuse, growth stops, and an individua
> The number of chocolate chips in an 18-ounce bag of Chips Ahoy! chocolate chip cookies is approximately normally distributed with a mean of 1262 chips and standard deviation 118 chips according to a study by cadets of the U.S. Air Force Academy. Source:
> A member of Congress wishes to determine her constituency’s opinion regarding estate taxes. She divides her constituency into three income classes: low-income households, middle-income households, and upper-income households. She then takes a simple rand
> Grams of carbohydrates in a doughnut
> The reading speed of sixth-grade students is approximately normal, with a mean speed of 125 words per minute and a standard deviation of 24 words per minute. (a) Draw a normal model that describes the reading speed of sixth-grade students. (b) Find and i
> The mean incubation time of fertilized chicken eggs kept at 100.5°F in a still-air incubator is 21 days. Suppose that the incubation times are approximately normally distributed with a standard deviation of 1 day. Source: University of Illinois Extension
> The 38th percentile
> The 81st percentile
> The 90th percentile
> The 9th percentile
> P(56 ≤ X < 66)
> P(38 < X ≤ 55)
> P(40 ≤ X ≤ 49)
> P(55 ≤ X ≤ 70)
> To determine customer opinion of its boarding policy, Southwest Airlines randomly selects 60 flights during a certain week and surveys all passengers on the flights.
> P(56 < X < 68)
> P(40 < X < 65)
> P(X ≤ 58)
> P(X ≤ 45)
> P(X > 65)
> P(X > 35)
> z0.15
> z0.025
> z0.02
> z0.01
> To determine the prevalence of human growth hormone (HGH) use among high school varsity baseball players, the State Athletic Commission randomly selects 50 high schools. All members of the selected high schools’ varsity baseball teams are tested for HGH.
> Find the z-scores that separate the middle 94% of the distribution from the area in the tails of the standard normal distribution.
> Find z-scores that separate the middle 99% of the distribution from the area in the tails of the standard normal distribution.
> Find the z-score such that the area under the standard normal curve to its right is 0.35.
> Find the z-score such that the area under the standard normal curve to its right is 0.25.
> Find the z-score such that the area under the standard normal curve to its left is 0.2.
> Find the z-score such that the area under the standard normal curve to its left is 0.1.
> Determine the total area under the standard normal curve (a) to the left of z = -2.94 or to the right of z = 2.94 (b) to the left of z = -1.68 or to the right of z = 3.05 (c) to the left of z = -0.88 or to the right of z = 1.23
> Determine the total area under the standard normal curve (a) to the left of z = -2 or to the right of z = 2 (b) to the left of z = -1.56 or to the right of z = 2.56 (c) to the left of z = -0.24 or to the right of z = 1.20
> Determine the area under the standard normal curve that lies between (a) z = -2.55 and z = 2.55 (b) z = -1.67 and z = 0 (c) z = -3.03 and z = 1.98
> Determine the area under the standard normal curve that lies between (a) z = -2.04 and z = 2.04 (b) z = -0.55 and z = 0 (c) z = -1.04 and z = 2.76
> To estimate the percentage of defects in a recent manufacturing batch, a quality-control manager at Intel selects every 8th chip that comes off the assembly line starting with the 3rd until she obtains a sample of 140 chips.
> Determine the area under the standard normal curve that lies to the right of (a) z = -3.49 (b) z = -0.55 (c) z = 2.23 (d) z = 3.45
> Determine the area under the standard normal curve that lies to the right of (a) z = -3.01 (b) z = -1.59 (c) z = 1.78 (d) z = 3.11

