Question: The histogram shows the reviewer ratings on
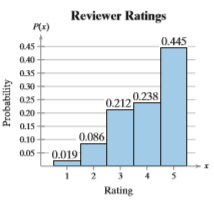
The histogram shows the reviewer ratings on a scale from 1 (lowest) to 5 (highest) of a recently published book.
Transcribed Image Text:
Reviewer Ratings P(x) 0.445 045 0.40 035 0.30 025 0.238 0.212 0.20 0.15 0.10 0.086 0.05 0.019 Rating Probability
> The histogram represents a binomial distribution with probability of success p. Match the histogram with the appropriate number of trials n. Explain your reasoning. What happens as the value of n increases and p remains the same? a. n = 4 b. n = 8
> The histogram represents a binomial distribution with 5 trials. Match the histogram with the appropriate probability of success p. Explain your reasoning. a. p = 0.25 b. p = 0.50 c. p = 0.75 P(x) 0.40 0.30 - 0.20 0.10 0 1 2 3 4 5
> Find the indicated probabilities and interpret the results. Refer to Exercise 33. A random sample of 2 years is selected. Find the probability that the mean amount of black carbon emissions for the sample is a. less than 12.3 gigagrams per year, b. bet
> The histogram represents a binomial distribution with 5 trials. Match the histogram with the appropriate probability of success p. Explain your reasoning. a. p = 0.25 b. p = 0.50 c. p = 0.75 P(x) 0.40 0.30 0.20 0.10 0 1 2 3 4 5
> An assembly line produces 10,000 automobile parts. Twenty percent of the parts are defective. An inspector randomly selects 10 of the parts. a. Use the Multiplication Rule to find the probability that none of the selected parts are defective. (Note that
> Another proposed theory in genetics gives the corresponding probabilities for the four types of plants described in Exercise 37 as 5/16, 4/16, 1/16, and 6/16. Ten plants are selected. Find the probability that 5 will be tall and colorful, 2 will be tall
> According to a theory in genetics, when tall and colorful plants are crossed with short and colorless plants, four types of plants will result: tall and colorful, tall and colorless, short and colorful, and short and colorless, with corresponding probabi
> Find the mean, variance, and standard deviation of the binomial distribution for the given random variable. Interpret the results. Ten percent of college graduates think that Judge Judy serves on the Supreme Court. You randomly select five college gradua
> Find the mean, variance, and standard deviation of the binomial distribution for the given random variable. Interpret the results. Thirty-two percent of U.S. employees who are late for work blame oversleeping. You randomly select six U.S. employees who a
> Find the mean, variance, and standard deviation of the binomial distribution for the given random variable. Interpret the results. Thirty-six percent of likely U.S. voters think that the federal government should get more involved in fighting local crime
> Find the mean, variance, and standard deviation of the binomial distribution for the given random variable. Interpret the results. Seventy-nine percent of U.S. adults believe that life on other planets is plausible. You randomly select eight U.S. adults
> Find the mean, variance, and standard deviation of the binomial distribution for the given random variable. Interpret the results. Fifty percent of adults are offended by how men portray women in rap and hip-hop music. You randomly select four adults and
> Find the mean, variance, and standard deviation of the binomial distribution for the given random variable. Interpret the results. Seventy-one percent of U.S. adults think that political correctness is a problem in America today. You randomly select seve
> Find the mean and standard deviation of the indicated sampling distribution of sample means. Then sketch a graph of the sampling distribution. The test scores for the Law School Admission Test (LSAT) in a recent year are normally distributed, with a mean
> a. construct a binomial distribution, b. graph the binomial distribution using a histogram and describe its shape, and c. identify any values of the random variable x that you would consider unusual. Explain your reasoning. Fifty-seven percent of schoo
> The histogram represents a binomial distribution with 5 trials. Match the histogram with the appropriate probability of success p. Explain your reasoning. a. p = 0.25 b. p = 0.50 c. p = 0.75 P(x) 0.40 0.30 0.20 0.10 0 1 2 3 4 5
> a. construct a binomial distribution, b. graph the binomial distribution using a histogram and describe its shape, and c. identify any values of the random variable x that you would consider unusual. Explain your reasoning. Seventy-seven percent of adu
> a. construct a binomial distribution, b. graph the binomial distribution using a histogram and describe its shape, and c. identify any values of the random variable x that you would consider unusual. Explain your reasoning. Fifty-seven percent of emplo
> a. construct a binomial distribution, b. graph the binomial distribution using a histogram and describe its shape, and c. identify any values of the random variable x that you would consider unusual. Explain your reasoning. Forty-nine percent of workin
> Find the indicated probabilities. If convenient, use technology or Table 2 in Appendix B. Forty-four percent of U.S. adults say they are more likely to make purchases during a sales tax holiday. You randomly select 15 adults. Find the probability that th
> Find the indicated probabilities. If convenient, use technology or Table 2 in Appendix B. Four percent of the U.S. workforce test positive for illicit drugs. You randomly select 14 workers. Find the probability that the number of workers who test positiv
> Find the indicated probabilities. If convenient, use technology or Table 2 in Appendix B. Twenty percent of consumers prefer to purchase groceries online. You randomly select 16 consumers. Find the probability that the number of consumers who prefer to p
> Find the indicated probabilities. If convenient, use technology or Table 2 in Appendix B. Forty percent of consumers prefer to purchase electronics online. You randomly select 11 consumers. Find the probability that the number of consumers who prefer to
> Find the indicated probabilities. If convenient, use technology or Table 2 in Appendix B. Eleven percent of U.S. adults eat fast food four to six times per week. You randomly select 12 U.S. adults. Find the probability that the number of U.S. adults who
> Find the mean and standard deviation of the indicated sampling distribution of sample means. Then sketch a graph of the sampling distribution. The per capita electric power consumption level in a recent year in Ecuador is normally distributed, with a mea
> Find the indicated probabilities. If convenient, use technology or Table 2 in Appendix B. Fifty-six percent of U.S. adults say they intend to get a flu shot. You randomly select 10 U.S. adults. Find the probability that the number of U.S. adults who inte
> Find the indicated probabilities. If convenient, use technology or Table 2 in Appendix B. Thirty-six percent of U.S. adults favor the use of unmanned drones by police agencies. You randomly select nine U.S. adults. Find the probability that the number of
> In a binomial experiment with n trials, what does the random variable measure?
> Find the indicated probabilities. If convenient, use technology or Table 2 in Appendix B. Thirty-four percent of U.S. adults have very little confidence in newspapers. You randomly select eight U.S. adults. Find the probability that the number of U.S. ad
> Determine whether the experiment is a binomial experiment. If it is, identify a success, specify the values of n, p, and q, and list the possible values of the random variable x. If it is not a binomial experiment, explain why. A survey found that 42% of
> Determine whether the experiment is a binomial experiment. If it is, identify a success, specify the values of n, p, and q, and list the possible values of the random variable x. If it is not a binomial experiment, explain why. A state lottery official r
> Determine whether the experiment is a binomial experiment. If it is, identify a success, specify the values of n, p, and q, and list the possible values of the random variable x. If it is not a binomial experiment, explain why. You draw five cards, one a
> Determine whether the experiment is a binomial experiment. If it is, identify a success, specify the values of n, p, and q, and list the possible values of the random variable x. If it is not a binomial experiment, explain why. A survey found that 36% of
> Find the mean, variance, and standard deviation of the binomial distribution with the given values of n and p. n = 316, p = 0.82
> Find the mean, variance, and standard deviation of the binomial distribution with the given values of n and p. n = 124, p = 0.26
> A population and sample size are given. a. Find the mean and standard deviation of the population. b. List all samples (with replacement) of the given size from the population and find the mean of each. c. Find the mean and standard deviation of the s
> Find the mean, variance, and standard deviation of the binomial distribution with the given values of n and p. n = 84, p = 0.65
> Find the mean, variance, and standard deviation of the binomial distribution with the given values of n and p. n = 50, p = 0.4
> Identify the unusual values of x in each histogram in Exercises 6–8.
> In a binomial experiment, what does it mean to say that each trial is independent of the other trials?
> The distribution of SAT mathematics scores for college-bound male seniors in 2016 has a mean of 524 and a standard deviation of 126. The distribution of SAT mathematics scores for college-bound female seniors in 2016 has a mean of 494 and a standard devi
> The distribution of SAT mathematics scores for college-bound male seniors in 2016 has a mean of 524 and a standard deviation of 126. The distribution of SAT mathematics scores for college-bound female seniors in 2016 has a mean of 494 and a standard devi
> Use this information about linear transformations. For a random variable x, a new random variable y can be created by applying a linear transformation y = a + bx, where a and b are constants. If the random variable x has mean µx and standard
> Use this information about linear transformations. For a random variable x, a new random variable y can be created by applying a linear transformation y = a + bx, where a and b are constants. If the random variable x has mean µx and standard
> Find the expected value E(x) to the player for one play of the game. If x is the gain to a player in a game of chance, then E(x) is usually negative. This value gives the average amount per game the player can expect to lose. A high school basketball tea
> Find the expected value E(x) to the player for one play of the game. If x is the gain to a player in a game of chance, then E(x) is usually negative. This value gives the average amount per game the player can expect to lose. In American roulette, the wh
> In a standardized IQ test, scores are normally distributed, with a mean score of 100 and a standardized deviation of 15. Out of 2000 randomly selected people, about how many would you expect to have IQ scores less than 90?
> In a game of chance, what is the relationship between a “fair bet” and its expected value? Explain.
> The expected value of an accountant’s profit and loss analysis is 0. Explain what this means.
> The histogram shows the distribution of hurricanes that have hit the U.S. mainland from 1851 through 2015 by Saffir-Simpson category, where 1 is the weakest level and 5 is the strongest level. U.S. Mainland Hurricanes P(x) 0.45 0.411 0.40 0.35 0.30 0
> The number of school-related extracurricular activities per student Activities 1 2 3 4 5 6. Probability 0.059 0.122 0.163 0.178 0.213 0.128 0.084 0.053
> The number of defects per 1000 machine parts inspected Defects 1 3 4 5 Probability 0.263 0.285 0.243 0.154 0.041 0.014
> a. Find the mean, variance, and standard deviation of the probability distribution, and b. Interpret the results. The number of games played in each World Series from 1903 through 2016 Games played 4 6. 7 8 Probability 0.188 0.223 0.214 0.348 0.027
> a. Find the mean, variance, and standard deviation of the probability distribution, and b. Interpret the results. The number of dogs per household in a neighborhood Dogs 1 2 3 4 5 Probability 0.686 0.195 0.077 0.022 0.013 0.007
> Determine whether the distribution is a probability distribution. If it is not a probability distribution, explain why. 1 3 4 P(x) 2.
> Determine whether the distribution is a probability distribution. If it is not a probability distribution, explain why. 1 2 3 4 P(x) 0.30 0.25 0.25 0.15 0.05
> In a standardized IQ test, scores are normally distributed, with a mean score of 100 and a standardized deviation of 15. What percent of the IQ scores are greater than 112?
> An online magazine finds that the mean number of typographical errors per page is five. Find the probability that the number of typographical errors found on any given page is a. exactly five, b. less than five, and c. exactly zero.
> Determine the missing probability for the probability distribution. 1 2 3 4 5 6 P(x) 0.05 0.17 0.23 0.21 0.11 0.08
> Determine the missing probability for the probability distribution. 2 3 4 P(x) 0.06 0.12 0.18 0.30
> In Exercise 20, would it be unusual for an employee to work two hours of overtime? Explain your reasoning.
> In Exercise 19, would it be unusual for a household to have no HD televisions? Explain your reasoning.
> Use the probability distribution you made in Exercise 20 to find the probability of randomly selecting an employee whose overtime is a. one or two hours, b. two hours or less, c. between three and six hours, inclusive, d. between one and three hours,
> Use the probability distribution you made in Exercise 19 to find the probability of randomly selecting a household that has a. one or two HD televisions, b. two or more HD televisions, c. between one and three HD televisions, inclusive, and d. at mos
> a. construct a probability distribution, and b. graph the probability distribution using a histogram and describe its shape. The number of overtime hours worked in one week per employee Overtime hours 0 1 2 3 4 5 6 Employees 6 12 29 57 42 30 16
> a. construct a probability distribution, and b. graph the probability distribution using a histogram and describe its shape. The number of high-definition (HD) televisions per household in a small town Televisions 0 1 2 3 Households 26 442 728 1404
> Determine whether the random variable x is discrete or continuous. Explain. Let x represent the snowfall (in inches) in Nome, Alaska, last winter.
> Determine whether the random variable x is discrete or continuous. Explain. Let x represent the number of texts a student sends in one day.
> In a standardized IQ test, scores are normally distributed, with a mean score of 100 and a standardized deviation of 15. Find the probability that a randomly selected person has an IQ score between 95 and 105. Is this an unusual event? Explain.
> Determine whether the random variable x is discrete or continuous. Explain. Let x represent the number of tornadoes in the month of May in Oklahoma.
> Determine whether the random variable x is discrete or continuous. Explain. Let x represent the volume of blood drawn for a blood test.
> Determine whether the random variable x is discrete or continuous. Explain. Let x represent the length of time it takes to complete an exam.
> Determine whether the random variable x is discrete or continuous. Explain. Let x represent the number of cars in a university parking lot.
> Determine whether the graph on the number line represents a discrete random variable or a continuous random variable. Explain your reasoning. The total annual arrests (in millions) in the United States 10 11 12 13 Arrests
> Determine whether the graph on the number line represents a discrete random variable or a continuous random variable. Explain your reasoning. The distance a baseball travels 12. The total annual arrests (in millions) after being hit 100 200 300 400 5
> Determine whether the graph on the number line represents a discrete random variable or a continuous random variable. Explain your reasoning. The length of time student-athletes practice each week 8 12 16 20 Time (in hours)
> Determine whether the graph on the number line represents a discrete random variable or a continuous random variable. Explain your reasoning. The attendance at concerts for 10. The length of time student-athletes a rock group 40,000 45,000 50,000 Att
> Determine whether the statement is true or false. If it is false, rewrite it as a true statement. The expected value of a random variable can never be negative.
> Construct the indicated confidence intervals for a. the population variance σ2 and b. the population standard deviation σ. Assume the sample is from a normally distributed population. c = 0.95, σ2 = 11.56, n = 30
> In a standardized IQ test, scores are normally distributed, with a mean score of 100 and a standardized deviation of 15. Find the probability that a randomly selected person has an IQ score higher than 125. Is this an unusual event? Explain.
> Find the critical values x2R and x2L for the level of confidence c and sample size n. c = 0.80, n = 51
> Find the critical values x2R and x2L for the level of confidence c and sample size n. c = 0.99, n = 30
> Find the critical values x2R and x2L for the level of confidence c and sample size n. c = 0.98, n = 26
> Find the critical values x2R and x2L for the level of confidence c and sample size n. c = 0.95, n = 20
> Find the critical values x2R and x2L for the level of confidence c and sample size n. c = 0.99, n = 15
> Find the critical values x2R and x2L for the level of confidence c and sample size n. c = 0.90, n = 8
> In your own words, explain how finding a confidence interval for a population variance is different from finding a confidence interval for a population mean or proportion.
> You are analyzing the sample of waiting times in Exercise 23. The population standard deviation of the waiting times should be less than 2.5 minutes. Does the confidence interval you constructed for s suggest that the variation in the waiting times is at
> You are analyzing the sample of car batteries in Exercise 21. The population standard deviation of the batteries’ reserve capacities should be less than 0.25 hour. Does the confidence interval you constructed for s suggest that the variation in the batte
> You are analyzing the sample of cough syrup bottles in Exercise 14. The population standard deviation of the volumes of the bottles’ contents should be less than 0.025 fluid ounce. Does the confidence interval you constructed for s suggest that the varia
> The random variable x is normally distributed with the given parameters. Find each probability. a. µ = 9.2, σ ≈ 1.62, P(x < 5.97) b. µ = 87, σ ≈ 19, P(x > 40.5) c. µ = 5.5, σ ≈ 0.08, P(5.36 < x < 5.64) d. µ = 18.5, σ ≈ 4.25, P(19.6 < x < 26.1)
> You are analyzing the sample of bolts in Exercise 13. The population standard deviation of the bolts’ diameters should be less than 0.5 inch. Does the confidence interval you constructed for s suggest that the variation in the bolts’ diameters is at an a
> Assume the sample is from a normally distributed population and construct the indicated confidence intervals for a. the population variance σ2 and b. the population standard deviation σ. Interpret the results. The prices of a random sample of 20 new m
> Assume the sample is from a normally distributed population and construct the indicated confidence intervals for a. the population variance σ2 and b. the population standard deviation σ. Interpret the results. The waiting times (in minutes) of a rando
> Assume the sample is from a normally distributed population and construct the indicated confidence intervals for a. the population variance σ2 and b. the population standard deviation σ. Interpret the results. The record high daily temperatures (in de
> Assume the sample is from a normally distributed population and construct the indicated confidence intervals for a. the population variance σ2 and b. the population standard deviation σ. Interpret the results. The reserve capacities (in hours) of 18 r
> Assume the sample is from a normally distributed population and construct the indicated confidence intervals for a. the population variance σ2 and b. the population standard deviation σ. Interpret the results. As part of a survey, you ask a random sam
> What happens to the shape of the chi-square distribution as the degrees of freedom increase?
> Assume the sample is from a normally distributed population and construct the indicated confidence intervals for a. the population variance σ2 and b. the population standard deviation σ. Interpret the results. As part of a water quality survey, you te
> Assume the sample is from a normally distributed population and construct the indicated confidence intervals for a. the population variance σ2 and b. the population standard deviation σ. Interpret the results. The numbers of touchdowns scored by 11 ra

