Question: The population (in millions) of the United
The population (in millions) of the United States (excluding Alaska and Hawaii) t years after 1800 is given by the function f (t) in Fig. 18(a). The graphs of f ‘(t) and f ’’(t) are shown in Figs. 18(b) and 18(c).
Figure 18:
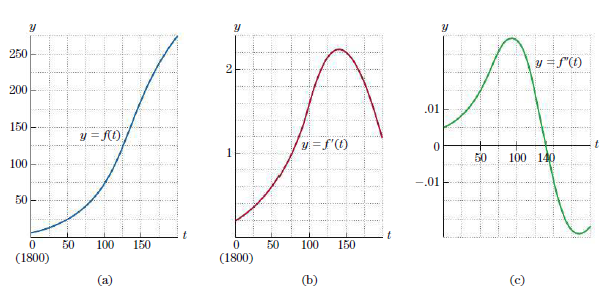
(a) What was the population in 1925?
(b) Approximately when was the population 25 million?
(c) How fast was the population growing in 1950?
(d) When during the last 50 years was the population growing at the rate of 1.8 million people per year?
(e) In what year was the population growing at the greatest rate?
Transcribed Image Text:
2 VAA y = f'(t) 250 200 150 100 50 y = f(t) 0 50 100 150 (1800) (a) 0 50 100 150 (1800) (b) .01 0 -.01 y = f(t) 100 140 (c)
> Find the maximum of Q = xy if x + y = 2.
> Find the x-intercepts of the given function. y = 4 - 2x - x2
> Find the x-intercepts of the given function. y = 2x2 + 5x + 2
> Write the equation of the tangent line to the curve y = x3 + 3x - 8 at (2, 6).
> Find the x-intercepts of the given function. y = x2 + 5x + 5
> Find the x-intercepts of the given function. y = x2 - 3x + 1
> The canopy height (in meters) of the tropical bunch-grass elephant millet t days after mowing (for t Ú 32) is f (t) = -3.14 + .142t - .0016t2 + .0000079t3 - .0000000133t4. (Source: Crop Science.) (a) Graph f (t) in the window [32, 250] by [-1.2, 4.5]. (b
> In a medical experiment, the body weight of a baby rat in the control group after t days was f (t) = 4.96 + .48t + .17t2 - .0048t3 grams. (Source: Growth, Development and Aging.) (a) Graph f (t) in the window [0, 20] by [-12, 50]. (b) Approximately how m
> If f (a) = 0 and f (x) is decreasing at x = a, explain why f (x) must have a local maximum at x = a.
> If f (a) = 0 and f (x) is increasing at x = a, explain why f (x) must have a local minimum at x = a.
> Find the quadratic function f (x) = ax2 + bx + c that goes through (0, 1) and has a local minimum at (1,-1).
> Find the quadratic function f (x) = ax2 + bx + c that goes through (2, 0) and has a local maximum at (0, 1).
> Determine which function is the derivative of the other. f(x) g(x) y X
> Determine which function is the derivative of the other. f(x) |(x)b y
> Find the slope of the tangent line to the curve y = x3 + 3x – 8 at (2, 6).
> Sketch the graphs of the following functions for x > 0. y = 1/√x + x/2
> Sketch the graphs of the following functions for x > 0. y = 6√x - x
> Sketch the graphs of the following functions for x > 0. y = 1/x2 + x/4 – 5/4
> Sketch the graphs of the following functions for x > 0. y = 2/x +x/2 + 2
> Sketch the graphs of the following functions for x > 0. y = 12/x + 3x + 1
> Sketch the graphs of the following functions for x > 0. y = 9/x + x + 1
> Sketch the graphs of the following functions for x > 0. y = 2/x
> Sketch the graphs of the following functions for x > 0. y = 1/x + ¼ x
> Sketch the graphs of the following functions. f (x) = (x + 2)4 - 1
> Sketch the graphs of the following functions. f (x) = (x - 3)4
> Find the slope of the graph of y = f (x) at the designated point. f (x) = x10 + 1 + √(1 – x), (0, 2)
> Differentiate. y = 1/3x3
> Sketch the graphs of the following functions. f (x) = 3x4 - 6x2 + 3
> Sketch the graphs of the following functions. f (x) = x4 - 6x2
> Sketch the graphs of the following functions. f (x) = 1/3 x3 - 2x2
> Sketch the graphs of the following functions. f (x) = 1 - 3x + 3x2 - x3
> Sketch the graphs of the following functions. f (x) = -3x3 - 6x2 - 9x - 6
> Sketch the graphs of the following functions. f (x) = 4/3 x3 - 2x2 + x
> Sketch the graphs of the following functions. f (x) = 2x3 + x - 2
> Sketch the graphs of the following functions. f (x) = 5 - 13x + 6x2 - x3
> Sketch the graphs of the following functions. f (x) = x3 + 2x2 + 4x
> Sketch the graphs of the following functions. f (x) = x3 + 3x + 1
> Find the slope of the graph of y = f (x) at the designated point. f (x) = 3x2 - 2x + 1, (1, 2)
> Sketch the graphs of the following functions. f (x) = -x3
> Sketch the graphs of the following functions. f (x) = x3 - 6x2 + 12x - 6
> Show that the function f (x) = -x3 + 2x2 - 6x + 3 is always decreasing.
> Show that the function f (x) = 1/3 x3 - 2x2 + 5x has no relative extreme points.
> Find the x-intercepts of the given function. y = 3x2 + 10x + 3
> Find the x-intercepts of the given function. y = 4x - 4x2 - 1
> The graph of the function has one relative maximum and one relative minimum point. Find these points using the first-derivative test. Use a variation chart as in Example 1. Variation Chart from Example 1: f (x) = x3 - 6x2 +1 Critical Values Interv
> The graph of the function has one relative maximum and one relative minimum point. Find these points using the first-derivative test. Use a variation chart as in Example 1. Variation Chart from Example 1: f (x) = x3 - 27x Critical Values Intervals
> Index-Fund Fees Suppose that the cost function in Exercise 45 is C(x) = -2.5x + 1, where x% is the index-fund fee. (The company has a fixed cost of $1 billion, and the cost decreases as a function of the index-fund fee.) Find the value of x that maximize
> When a mutual fund company charges a fee of 0.47% on its index funds, its assets in the fund are $41 billion. And when it charges a fee of 0.18%, its assets in the fund are $300 billion. (Source: The Boston Globe.) (a) Let x % denote the fee that the com
> Differentiate. y = (x – 1/x)-1
> Consider the graph of g(x) in Fig. 17. (a) If g(x) is the first derivative of f (x), describe f (x) when x = 2? (b) If g(x) is the second derivative of f (x), describe f (x) when x = 2? Figure 17: y Figure 17 2 y = g(x) x
> Determine which function is the derivative of the other. x- (x)b = h (x)f=h fi
> Determine which function is the derivative of the other. fi y = f(x) y = g(x)
> The graph of function has one relative extreme point. Find it (giving both x- and y-coordinates) and determine if it is a relative maximum or a relative minimum point. Do not include a sketch of the graph of the function. f (x) = 5x2 + x - 3
> The graph of function has one relative extreme point. Find it (giving both x- and y-coordinates) and determine if it is a relative maximum or a relative minimum point. Do not include a sketch of the graph of the function. g(x) = x2 + 10x + 10
> The graph of function has one relative extreme point. Find it (giving both x- and y-coordinates) and determine if it is a relative maximum or a relative minimum point. Do not include a sketch of the graph of the function. g(x) = 3 + 4x - 2x2
> The graph of function has one relative extreme point. Find it (giving both x- and y-coordinates) and determine if it is a relative maximum or a relative minimum point. Do not include a sketch of the graph of the function. f (x) = 5 - 12x - 2x2
> The graph of function has one relative extreme point. Find it (giving both x- and y-coordinates) and determine if it is a relative maximum or a relative minimum point. Do not include a sketch of the graph of the function. f (x) = 1/4 x2 - 2x + 7
> Let a, b, c, d be fixed numbers with a ≠ 0, and let f (x) = ax3 + bx2 + cx + d. Is it possible for the graph of f (x) to have more than one inflection point? Explain your answer.
> Differentiate. f (x) = (√x/2 + 1)3/2
> Let a, b, c be fixed numbers with a ≠ 0, and let f (x) = ax2 + bx + c. Is it possible for the graph of f (x) to have an inflection point? Explain your answer.
> Sketch the following curves, indicating all relative extreme points and inflection points. y = x4 – 4/3 x3
> Sketch the following curves, indicating all relative extreme points and inflection points. y = 2x3 - 3x2 - 36x + 20
> Sketch the following curves, indicating all relative extreme points and inflection points. y = x4 + 1/3 x3 - 2x2 - x + 1
> Sketch the following curves, indicating all relative extreme points and inflection points. y = 1/3 x3 - x2 - 3x + 5
> Sketch the following curves, indicating all relative extreme points and inflection points. y = -x3 + 12x - 4
> Sketch the following curves, indicating all relative extreme points and inflection points. y = 1 + 3x2 - x3
> Sketch the following curves, indicating all relative extreme points and inflection points. y = x3 - 6x2 + 9x + 3
> Sketch the following curves, indicating all relative extreme points and inflection points. y = x3 - 3x + 2
> The graph of the function has one relative maximum and one relative minimum point. Plot these two points and check the concavity there. Using only this information, sketch the graph. ƒ(x) = {x³ + 2x² − 5x +
> Differentiate. y = π2x
> The graph of the function has one relative maximum and one relative minimum point. Plot these two points and check the concavity there. Using only this information, sketch the graph. f(x) = −x³ + 2x² - 12
> The graph of the function has one relative maximum and one relative minimum point. Plot these two points and check the concavity there. Using only this information, sketch the graph. 3 f(x) = 2x³ − 15x² + 36x - 24
> The graph of the function has one relative maximum and one relative minimum point. Plot these two points and check the concavity there. Using only this information, sketch the graph. 3 f(x) = -√√x³ + x² + 9x
> The graph of the function has one relative maximum and one relative minimum point. Plot these two points and check the concavity there. Using only this information, sketch the graph. f(x) = x³ + 9x - 2
> The graph of the function has one relative maximum and one relative minimum point. Plot these two points and check the concavity there. Using only this information, sketch the graph. f(x) = x³ - 12x
> The graph of the function has one relative maximum and one relative minimum point. Plot these two points and check the concavity there. Using only this information, sketch the graph. f(x) = x³ = x²
> The graph of the function has one relative maximum and one relative minimum point. Plot these two points and check the concavity there. Using only this information, sketch the graph. f (x) = x3 + 6x2 + 9x
> The graph of the function has one relative extreme point. Plot this point and check the concavity there. Using only this information, sketch the graph. [Recall that if f (x) = ax2 + bx + c, then f (x) has a relative minimum point when a > 0 and a relativ
> The graph of the function has one relative extreme point. Plot this point and check the concavity there. Using only this information, sketch the graph. [Recall that if f (x) = ax2 + bx + c, then f (x) has a relative minimum point when a > 0 and a relativ
> The graph of the function has one relative extreme point. Plot this point and check the concavity there. Using only this information, sketch the graph. [Recall that if f (x) = ax2 + bx + c, then f (x) has a relative minimum point when a > 0 and a relativ
> Differentiate. y = x + 1 + √(x + 1)
> The graph of the function has one relative extreme point. Plot this point and check the concavity there. Using only this information, sketch the graph. [Recall that if f (x) = ax2 + bx + c, then f (x) has a relative minimum point when a > 0 and a relativ
> The graph of the function has one relative extreme point. Plot this point and check the concavity there. Using only this information, sketch the graph. [Recall that if f (x) = ax2 + bx + c, then f (x) has a relative minimum point when a > 0 and a relativ
> The graph of the function has one relative extreme point. Plot this point and check the concavity there. Using only this information, sketch the graph. [Recall that if f (x) = ax2 + bx + c, then f (x) has a relative minimum point when a > 0 and a relativ
> The graph of the function has one relative extreme point. Plot this point and check the concavity there. Using only this information, sketch the graph. [Recall that if f (x) = ax2 + bx + c, then f (x) has a relative minimum point when a > 0 and a relativ
> The graph of the function has one relative extreme point. Plot this point and check the concavity there. Using only this information, sketch the graph. [Recall that if f (x) = ax2 + bx + c, then f (x) has a relative minimum point when a > 0 and a relativ
> The graph of the function has one relative maximum and one relative minimum point. Find these points using the first-derivative test. Use a variation chart as in Example 1. Variation Chart from Example 1: f (x) = 2x3 + 3x2 - 3 Critical Values Inte
> The graph of the function has one relative maximum and one relative minimum point. Find these points using the first-derivative test. Use a variation chart as in Example 1. Variation Chart from Example 1: f (x) = -x3 - 12x2 - 2 Critical Values Int
> The graph of the function has one relative maximum and one relative minimum point. Find these points using the first-derivative test. Use a variation chart as in Example 1. Variation Chart from Example 1: f (x) = 4/3 x3 - x + 2 Critical Values Int
> The graph of the function has one relative maximum and one relative minimum point. Find these points using the first-derivative test. Use a variation chart as in Example 1. Variation Chart from Example 1: f (x) = 1/3 x3 – x2 + 1
> The graph of the function has one relative maximum and one relative minimum point. Find these points using the first-derivative test. Use a variation chart as in Example 1. Variation Chart from Example 1: f (x) = -6x3 – 3/2 x2 + 3x -
> Differentiate. y = (1 + x + x2)11
> The graph of the function has one relative maximum and one relative minimum point. Find these points using the first-derivative test. Use a variation chart as in Example 1. Variation Chart from Example 1: f (x) = -x3 + 6x2 - 9x + 1 Critical Values
> Refer to the functions whose graphs are given in Fig. 17. Figure 17: Which functions have a negative second derivative for all x? Y Y (a) (d) Figure 17 Y Y (b) (e) Y Y (c) (f)
> Refer to the functions whose graphs are given in Fig. 17. Figure 17: Which functions have a positive second derivative for all x? Y Y (a) (d) Figure 17 Y Y (b) (e) Y Y (c) (f)
> Refer to the functions whose graphs are given in Fig. 17. Figure 17: Which functions have a negative first derivative for all x? Y Y (a) (d) Figure 17 Y Y (b) (e) Y Y (c) (f)
> Refer to the functions whose graphs are given in Fig. 17. Figure 17: Which functions have a positive first derivative for all x?
> Display the graph of the derivative of f (x) in the specified window. Then use the graph of f (x) to determine the approximate values of x at which the graph of f (x) has relative extreme points and inflection points. Then check your conclusions by disp
> Display the graph of the derivative of f (x) in the specified window. Then use the graph of f (x) to determine the approximate values of x at which the graph of f (x) has relative extreme points and inflection points. Then check your conclusions by disp
> After a drug is taken orally, the amount of the drug in the bloodstream after t hours is f (t) units. Figure 27 shows partial graphs of f ‘(t) and f ’’(t). Figure 27: (a) Is the amount of the drug

