Question: Use the values on the number line
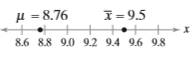
Use the values on the number line to find the sampling error.
Transcribed Image Text:
µ = 8.76 I = 9.5 +++++X 8.6 8.8 9.0 9.2 9.4 9.6 9.8
> The table shows the ages of students in a freshman orientation course. a. Construct a probability distribution. b. Graph the probability distribution using a histogram and describe its shape. c. Find the mean, variance, and standard deviation of the p
> An admissions director wants to estimate the mean age of all students enrolled at a college. The estimate must be within 1.5 years of the population mean. Assume the population of ages is normally distributed. a. Determine the minimum sample size requir
> Find the critical value zc necessary to construct a confidence interval at the level of confidence c. c = 0.80
> A cheese processing company wants to estimate the mean cholesterol content of all one-ounce servings of a type of cheese. The estimate must be within 0.75 milligram of the population mean. a. Determine the minimum sample size required to construct a 95%
> Determine the minimum sample size required when you want to be 99% confident that the sample mean is within two units of the population mean and σ = 1.4. Assume the population is normally distributed.
> Determine the minimum sample size required when you want to be 95% confident that the sample mean is within one unit of the population mean and σ = 4.8. Assume the population is normally distributed.
> Use the information to construct 90% and 99% confidence intervals for the population mean. Interpret the results and compare the widths of the confidence intervals. The sodium chloride concentrations (in grams per liter) for 36 randomly selected seawater
> Use the information to construct 90% and 99% confidence intervals for the population mean. Interpret the results and compare the widths of the confidence intervals. A group of researchers estimates the mean length of time (in minutes) the average U.S. ad
> Describe how you would construct a 90% confidence interval to estimate the population mean age for students at your school.
> When all other quantities remain the same, how does the indicated change affect the width of a confidence interval? Explain. a. Increase in the level of confidence b. Increase in the sample size c. Increase in the population standard deviation
> In Exercise 38, does it seem possible that the population mean could be less than 100? Explain.
> Determine whether the distribution is a probability distribution. If it is not a probability distribution, explain why. (a) 5 10 15 20 P(x) 0.03 0.09 0.19 0.32 0.37 (b) 1 4 5 6 P(x) 20 10 3. 10 25 3. 2.
> In Exercise 37, does it seem possible that the population mean could be greater than 90°F? Explain.
> In Exercise 36, does it seem possible that the population mean could be within 1% of the sample mean? Explain.
> You construct a 95% confidence interval for a population mean using a random sample. The confidence interval is 24.9 < µ < 31.5. Is the probability that µ is in this interval 0.95? Explain.
> In Exercise 35, does it seem possible that the population mean could equal the sample mean? Explain.
> You are given the sample mean and the population standard deviation. Use this information to construct 90% and 95% confidence intervals for the population mean. Interpret the results and compare the widths of the confidence intervals. From a random sampl
> You are given the sample mean and the population standard deviation. Use this information to construct 90% and 95% confidence intervals for the population mean. Interpret the results and compare the widths of the confidence intervals. From a random sampl
> You are given the sample mean and the population standard deviation. Use this information to construct 90% and 95% confidence intervals for the population mean. Interpret the results and compare the widths of the confidence intervals. From a random sampl
> You are given the sample mean and the population standard deviation. Use this information to construct 90% and 95% confidence intervals for the population mean. Interpret the results and compare the widths of the confidence intervals. From a random sampl
> Use the confidence interval to find the estimated margin of error. Then find the sample mean. A store manager reports a confidence interval of (244.07, 280.97) when estimating the mean price (in dollars) for the population of textbooks.
> Use the confidence interval to find the estimated margin of error. Then find the sample mean. A government agency reports a confidence interval of (26.2, 30.1) when estimating the mean commute time (in minutes) for the population of workers in a city.
> Find the indicated probabilities using the geometric distribution, the Poisson distribution, or the binomial distribution. Then determine whether the events are unusual. If convenient, use a table or technology to find the probabilities. The mean increas
> Determine the minimum sample size n needed to estimate m for the values of c, σ, and E. c = 0.98, σ = 10.1, E = 2
> Determine the minimum sample size n needed to estimate m for the values of c, σ, and E. c = 0.80, σ = 4.1, E = 2
> Determine the minimum sample size n needed to estimate m for the values of c, σ, and E. c = 0.95, σ = 2.5, E = 1
> For the same sample statistics, which level of confidence would produce the widest confidence interval? Explain your reasoning. a. 90% b. 95% c. 98% d. 99%
> Determine the minimum sample size n needed to estimate m for the values of c, σ, and E. c = 0.90, σ = 6.8, E = 1
> Use the confidence interval to find the margin of error and the sample mean. (3.144, 3.176)
> Use the confidence interval to find the margin of error and the sample mean. (1.71, 2.05)
> Use the confidence interval to find the margin of error and the sample mean. (21.61, 30.15)
> Use the confidence interval to find the margin of error and the sample mean. (12.0, 14.8)
> Construct the indicated confidence interval for the population mean µ. c = 0.80, x = 20.6, σ = 4.7, n = 100
> a. find the mean, variance, and standard deviation of the probability distribution, and b. interpret the results. The number of cell phones per household in a small town Cell phones 1 2 3 4 5 6 Probability 0.020 0.140 0.272 0
> Construct the indicated confidence interval for the population mean µ. c = 0.99, x = 10.50, σ = 2.14, n = 45
> Construct the indicated confidence interval for the population mean µ. c = 0.95, x = 31.39, σ = 0.80, n = 82
> Construct the indicated confidence interval for the population mean µ. c = 0.90, x = 12.3, σ = 1.5, n = 50
> Match the level of confidence c with the appropriate confidence interval. Assume each confidence interval is constructed for the same sample statistics. c = 0.98 (a) 54.9 57.2 59.5 (b) 55.2 57.2 59.2 54 55 56 57 58 59 60 54 55 56 57 58 59 60 (c) 55.6
> Which statistic is the best unbiased estimator for µ? a. σ b. x c. the median d. the mode
> Match the level of confidence c with the appropriate confidence interval. Assume each confidence interval is constructed for the same sample statistics. c = 0.95 (a) 54.9 57.2 59.5 (b) 55.2 57.2 59.2 54 55 56 57 58 59 60 54 55 56 57 58 59 60 (c) 55.6
> Match the level of confidence c with the appropriate confidence interval. Assume each confidence interval is constructed for the same sample statistics. c = 0.90 (a) 54.9 57.2 59.5 (b) 55.2 57.2 59.2 54 55 56 57 58 59 60 54 55 56 57 58 59 60 (c) 55.6
> Match the level of confidence c with the appropriate confidence interval. Assume each confidence interval is constructed for the same sample statistics. c = 0.88 (a) 54.9 57.2 59.5 (b) 55.2 57.2 59.2 54 55 56 57 58 59 60 54 55 56 57 58 59 60 (c) 55.6
> Find the margin of error for the values of c, σ, and n. c = 0.975, σ = 4.6, n = 100
> Find the margin of error for the values of c, σ, and n. c = 0.80, σ = 1.3, n = 75
> Determine whether the distribution is a probability distribution. If it is not a probability distribution, explain why. The random variable x represents the number of classes in which a student is enrolled in a given semester at a university. 1 3 5 P
> Find the margin of error for the values of c, σ, and n. c = 0.90, σ = 2.9, n = 50
> Find the margin of error for the values of c, σ, and n. c = 0.95, σ = 5.2, n = 30
> Use the values on the number line to find the sampling error. I = 46.56 u = 48.12 46 47 48 49
> Use the values on the number line to find the sampling error. u = 24.67 I= 26.43 24 25 26 27
> When estimating a population mean, are you more likely to be correct when you use a point estimate or an interval estimate? Explain your reasoning.
> Write the binomial probability in words. Then, use a continuity correction to convert the binomial probability to a normal distribution probability. P(x < 25)
> Match the binomial probability statement with its corresponding normal distribution probability statement (a)–(d) after a continuity correction. P(x < 109) a. P(x > 109.5) b. P(x < 108.5) c. P(x < 109.5) d. P(x > 108.5)
> Match the binomial probability statement with its corresponding normal distribution probability statement (a)–(d) after a continuity correction. P(x ≤ 109) a. P(x > 109.5) b. P(x < 108.5) c. P(x < 109.5) d. P(x > 108.5)
> Match the binomial probability statement with its corresponding normal distribution probability statement (a)–(d) after a continuity correction. P(x ≥ 109) a. P(x > 109.5) b. P(x < 108.5) c. P(x < 109.5) d. P(x > 108.5)
> Determine whether the distribution is a probability distribution. If it is not a probability distribution, explain why. The random variable x represents the number of tickets a police officer writes out each shift. 1 2 3 4 5 P(x) 0.09 0.23 0.29 0.16
> Match the binomial probability statement with its corresponding normal distribution probability statement (a)–(d) after a continuity correction. P(x > 109) a. P(x > 109.5) b. P(x < 108.5) c. P(x < 109.5) d. P(x > 108.5)
> The sample size n, probability of success p, and probability of failure q are given for a binomial experiment. Determine whether you can use a normal distribution to approximate the distribution of x. n = 20, p = 0.65, q = 0.35
> A drug manufacturer claims that a drug cures a rare skin disease 75% of the time. The claim is checked by testing the drug on 100 patients. If at least 70 patients are cured, then this claim will be accepted. Find the probability that the claim will be a
> A drug manufacturer claims that a drug cures a rare skin disease 75% of the time. The claim is checked by testing the drug on 100 patients. If at least 70 patients are cured, then this claim will be accepted. Find the probability that the claim will be r
> The figure shows the results of a survey of U.S. adults ages 33 to 51 who were asked whether they participated in a sport. Seventy percent of U.S. adults ages 33 to 51 said they regularly participated in at least one sport, and they gave their favorite s
> The sample size n, probability of success p, and probability of failure q are given for a binomial experiment. Determine whether you can use a normal distribution to approximate the distribution of x. n = 18, p = 0.90, q = 0.10
> The figure shows the results of a survey of U.S. adults ages 33 to 51 who were asked whether they participated in a sport. Seventy percent of U.S. adults ages 33 to 51 said they regularly participated in at least one sport, and they gave their favorite s
> A survey of U.S. adults found that 8% believe the biggest problem in schools today is poor teaching. You randomly select a sample of U.S. adults. Find the probability that more than 100 U.S. adults believe the biggest problem in schools today is poor tea
> About 3.3% of hourly paid U.S. workers earn the prevailing minimum wage or less. A grocery chain offers discount rates to companies that have at least 30 employees who earn the prevailing minimum wage or less. Find the probability that each company will
> Determine whether you can use a normal distribution to approximate the binomial distribution. If you can, use the normal distribution to approximate the indicated probabilities and sketch their graphs. If you cannot, explain why and use a binomial distri
> a. construct a probability distribution, and b. graph the probability distribution using a histogram and describe its shape. The number of hours students in a college class slept the previous night 7 8 Hours 4 5 9 10 Students
> Thirty-six percent of U.S. adults have postponed medical checkups or procedures to save money. You randomly select nine U.S. adults. Find the probability that the number of U.S. adults who have postponed medical checkups or procedures to save money is a
> Determine whether you can use a normal distribution to approximate the binomial distribution. If you can, use the normal distribution to approximate the indicated probabilities and sketch their graphs. If you cannot, explain why and use a binomial distri
> Determine whether you can use a normal distribution to approximate the binomial distribution. If you can, use the normal distribution to approximate the indicated probabilities and sketch their graphs. If you cannot, explain why and use a binomial distri
> Determine whether you can use a normal distribution to approximate the binomial distribution. If you can, use the normal distribution to approximate the indicated probabilities and sketch their graphs. If you cannot, explain why and use a binomial distri
> Determine whether you can use a normal distribution to approximate the binomial distribution. If you can, use the normal distribution to approximate the indicated probabilities and sketch their graphs. If you cannot, explain why and use a binomial distri
> Determine whether you can use a normal distribution to approximate the binomial distribution. If you can, use the normal distribution to approximate the indicated probabilities and sketch their graphs. If you cannot, explain why and use a binomial distri
> Determine whether you can use a normal distribution to approximate the binomial distribution. If you can, use the normal distribution to approximate the indicated probabilities and sketch their graphs. If you cannot, explain why and use a binomial distri
> The sample size n, probability of success p, and probability of failure q are given for a binomial experiment. Determine whether you can use a normal distribution to approximate the distribution of x. n = 15, p = 0.70, q = 0.30
> Determine whether you can use a normal distribution to approximate the binomial distribution. If you can, use the normal distribution to approximate the indicated probabilities and sketch their graphs. If you cannot, explain why and use a binomial distri
> A binomial experiment is given. Determine whether you can use a normal distribution to approximate the binomial distribution. If you can, find the mean and standard deviation. If you cannot, explain why. Sixty-five percent of parents of teenagers have ta
> A binomial experiment is given. Determine whether you can use a normal distribution to approximate the binomial distribution. If you can, find the mean and standard deviation. If you cannot, explain why. In a recent year, alcohol-impaired driving was the
> a. construct a probability distribution, and b. graph the probability distribution using a histogram and describe its shape. The number of hits per game played by a Major League Baseball player Hits 0 1 2 3 4 5 Games 29 62 33
> Write the binomial probability and the normal probability for the shaded region of the graph. Find the value of each probability and compare the results. P(x) 0.24 n = 12 p = 0.5 0.20 0.16 0.12 0.08 0.04 0 2 4 6 8 10 12
> Write the binomial probability and the normal probability for the shaded region of the graph. Find the value of each probability and compare the results. P(x) 0.24 n= 16 0.20 p = 0.4| 0.16 0.12 0.08 0.04 0 2 4 6 8 10 12 14 16
> Write the binomial probability in words. Then, use a continuity correction to convert the binomial probability to a normal distribution probability. P(55 < x < 60)
> Write the binomial probability in words. Then, use a continuity correction to convert the binomial probability to a normal distribution probability. P(x ≤ 150)
> Write the binomial probability in words. Then, use a continuity correction to convert the binomial probability to a normal distribution probability. P(x > 65)
> Write the binomial probability in words. Then, use a continuity correction to convert the binomial probability to a normal distribution probability. P(x = 33)
> Write the binomial probability in words. Then, use a continuity correction to convert the binomial probability to a normal distribution probability. P(x ≥ 110)
> The sample size n, probability of success p, and probability of failure q are given for a binomial experiment. Determine whether you can use a normal distribution to approximate the distribution of x. n = 24, p = 0.85, q = 0.15
> The graph of a population distribution is shown with its mean and standard deviation. Random samples of size 100 are drawn from the population. Determine which of the figures labeled (a)–(c) would most closely resemble the sampling dist
> Determine whether the statement is true or false. If it is false, rewrite it as a true statement. If the sample size is at least 30, then you can use z-scores to determine the probability that a sample mean falls in a given interval of the sampling distr
> Determine whether the random variable x is discrete or continuous. Explain. Let x represent the weight of a truck at a weigh station.
> Determine whether the statement is true or false. If it is false, rewrite it as a true statement. A sampling distribution is normal only when the population is normal.
> Determine whether the statement is true or false. If it is false, rewrite it as a true statement. As the sample size increases, the standard deviation of the distribution of sample means increases.
> Determine whether the statement is true or false. If it is false, rewrite it as a true statement. As the sample size increases, the mean of the distribution of sample means increases.
> Assume the sampling distribution of sample proportions is a normal distribution. About 74% of the residents in a town say that they are making an effort to conserve water or electricity. One hundred ten residents are randomly selected. What is the probab
> Assume the sampling distribution of sample proportions is a normal distribution. About 63% of the residents in a town are in favor of building a new high school. One hundred five residents are randomly selected. What is the probability that the sample pr
> Determine whether the finite correction factor should be used. If so, use it in your calculations when you find the probability. In a sample of 100 eruptions of the Old Faithful geyser at Yellowstone National Park, the mean interval between eruptions was
> A population has a mean µ and a standard deviation σ. Find the mean and standard deviation of the sampling distribution of sample means with sample size n. µ = 1275, σ = 6, n = 1000
> Determine whether the finite correction factor should be used. If so, use it in your calculations when you find the probability. In a sample of 1000 fines issued by the city of Toronto for parking infractions, the mean fine was $47.12 and the standard de
> The weights of ice cream cartons are normally distributed with a mean weight of 10 ounces and a standard deviation of 0.5 ounce. a. What is the probability that a randomly selected carton has a weight greater than 10.21 ounces? b. You randomly select 2
> The lengths of lumber a machine cuts are normally distributed, with a mean of 96 inches and a standard deviation of 0.5 inch. a. What is the probability that a randomly selected board cut by the machine has a length greater than 96.25 inches? b. You ra
> Determine whether the random variable x is discrete or continuous. Explain. Let x represent the number of pumps in use at a gas station.

