Question: Why, and in what sense, do the
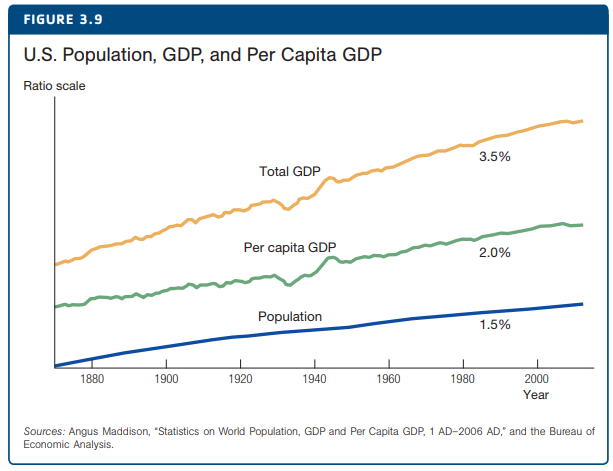
Why, and in what sense, do the three growth rates shown in Figure 3.9 add up?
Figure 3.9:
Transcribed Image Text:
FIGURE 3.9 U.S. Population, GDP, and Per Capita GDP Ratio scale 3.5% Total GDP Per capita GDP 2.0% Population 1.5% 1880 1900 1920 1940 1960 1980 2000 Year Sources: Angus Maddison, "Statistics on World Population, GDP and Per Capita GDP, 1 AD-2006 AD," and the Bureau of Economic Analysis.
> Now we add some parameters to the labor market model: labor supply: Ls =
> Suppose the real return on investing in a machine is 5% and the inflation rate is 4%. (a) According to the Fisher equation, what should the nominal interest rate be? (b) Suppose bank A charges a nominal interest rate on loans equal to 8%. What happens? (
> What is the key endogenous variable in the quantity theory? Explain the effect on this key variable of the following changes: (a) The money supply is doubled. (b) The velocity of money increases by 10%. (c) Real GDP rises by 2%. (d) The money supply incr
> Using the FRED database, download a graph of the inflation rate for China and India. (For help with using the FRED data, see Case Study “The FRED Database” Chapter 2 on page 34.) (a) Display the two graphs. (b) What is the average inflation rate in each
> As in exercise 15, the amount of money the government raises from the inflation tax is DM. (a) Write this amount as a ratio to nominal GDP. Multiply and divide by M to get an expression for the ratio of revenue from the inflation tax to GDP. Your answer
> The amount of money the government raises from the inflation tax is DM. Use the FRED database for the last period in each year to answer the following questions: (a) How much currency was in circulation in 1981? What was the size of the monetary base in
> The complete version of the Thomas Sargent quote that began this chapter is “Persistent high inflation is always and everywhere a fiscal phenomenon.” Why did Sargent include the modifiers “persistent high”?
> Consider two possible inflation scenarios. In one, the inflation rate is 100% per year, but it has been at this level for three decades and the central bank says it will keep it there forever. In the other, the inflation rate was 3% for two decades but j
> Consider the following two questions. (a) Can the real interest rate be negative? In what circumstances? (b) Can the nominal interest rate be negative? Discuss.
> Using the FRED database, create a single graph containing the 10-year government bond yield (one measure of a nominal interest rate) and the inflation rate for Italy. You may find it helpful to use the search terms “government bond yield Italy” and “infl
> Using the data on the consumer price index reported in Table 8.1, calculate the value in 2015 of the following items (refer to the nearest year in the table to do each calculation): (a) The salary of a worker in 1900: $1,000 per year. (b) Bab
> Consider an economy that produces oranges and boomerangs. The prices and quantities of these goods in two different years are reported in the table below. Fill in the missing entries. Percentage change 2020-2021 2020 2021 Quantity of oranges Quantit
> In the text, we supposed a college education raised a person’s wage by $30,000 per year, from $40,000 to $70,000. Assume the interest rate is 3% and there is no growth in wages, then answer the following. (a) Suppose you are a high school senior deciding
> To make the calculation of the present discounted value of a worker’s human capital more realistic, suppose labor income starts at $50,000 initially, but then grows at a constant rate of 2% per year after that. Let wt be labor income in year t, so that w
> Review the discussion of the value of a typical worker’s human capital in Section 7.6 on page 191. (a) Re compute the present discounted value in the following cases: R = 0.01, R = 0.02, R = 0.04, R = 0.05. (b) What is the economic intuition for why t
> Repeat exercise 4 for an interest rate of 1%, then for an interest rate of 5%. Arrange your answers in a table so you can more easily see the difference a change in the interest rate makes. Data from exercise 4: Suppose scientists discover a new way to
> Suppose the government decides to reform the tax system to reduce the marginal income tax rate across the board. Explain the effect on wages, the employment- population ratio, and unemployment.
> Using the FRED database, download graphs of the U.S. employment- population ratio for men and women. (For help with FRED, see the case study “The FRED Database” in Chapter 2 on page 34.) (a) Display the graphs. (b) What are some possible explanations fo
> GDP per hour: Assume annual hours worked per person in the United States is equal to 800. Using the data from Table 7.2 and the “Country Snapshots” file (snapshots.pdf), compute GDP per hour for the other c
> Consider the following two proposals to reform unemployment insurance. Explain the arguments for and against each reform. (a) The insurance payment would be increased so that it replaced 100% of a worker’s regular labor income for 26 weeks. (b) Each work
> Suppose the U.S. unemployment rate in October 2009 had been 6% instead of 10.0%. How many more people would have been working (assuming the labor force remained the same)?
> Consider the following variation: Yt = A1/2 t Lyt , ∆ At+1 = z At Lat , Lyt + Lat =
> Look back at Table 2.4. Some missing entries are labeled with question marks. Compute the values that belong in these positions. Table 2.4: TABLE 2.4 Real and Nominal GDP in a Simple Economy, 2018–2020 Percentage change 2019
> In 2015, the U.S. National Income Accounts began to “count” intellectual property products— such as R&D, computer software, books, music, and movies— explicitly as investment. More correctly, they had previously assumed these products were an intermediat
> Now suppose the parameters of the model take the following values:
> Suppose we have two economies— let’s call them Earth and Mars—that are identical, except that one begins with a stock of ideas that is twice as large as the other:
> Suppose the economy is on a balanced growth path in the Romer model, and then, in the year 2030, research productivity
> What is the growth rate of output per person in Figure 6.2? What are the growth rates of output per person before and after the changes in the parameter values in Figures 6.3 and 6.4? Figure 6.2: Figure 6.3: Figur
> (a) Use the production function in equation (5.6) and the rules for computing growth rates from page 53 of Chapter 3 to write the growth rate of per capita GDP as a function of the growth rate of the capital stock. (b) Combine this result with the last e
> Suppose an economy begins in steady state. By what proportion does per capita GDP change in the long run in response to each of the following changes? (a) The investment rate doubles. (b) The depreciation rate falls by 10%. (c) The productivity level ris
> Search the FRED database for the “investment share of GDP” and one of the first links to appear is for “gross private domestic investment.” (For help with using the FRED data, refer back to the case study “The FRED Database” in Chapter 2 on page 34.) (a)
> Consider a Solow economy that begins with a capital stock equal to $300 billion, and suppose its steady- state level of capital is $500 billion. To its pleasant surprise, the economy receives a generous gift of foreign aid in the form of $100 billion wor
> Consider a onetime change in government policy that immediately and permanently increases the level of the labor force in an economy (such as a more generous immigration policy). In particular, suppose it rises permanently from
> Download the file snapshots.pdf from web.stanford.edu/chadj/snapshots.html and answer the following. (At the moment, the latest year in the data file is 2014. Over time, this year will advance, so please use the latest year available in the Country Snaps
> One explanation for China’s rapid economic growth during the past several decades is its expansion of policies that encourage “technology transfer.” By this, we mean policies— such as opening up to international trade and attracting multinational corpora
> Consider a Solow model where the production function no longer exhibits diminishing returns to capital accumulation. This is not particularly realistic, for reasons discussed in Chapter 4. But it is interesting to consider this case nonetheless because o
> By manipulating the equations of the Solow model mathematically, it is possible to make more precise quantitative statements about the behavior of growth rates over time. For example, one way of quantifying the principle of transition dynamics is with th
> Suppose an economy begins in steady state and is characterized by the following parameter values:
> Suppose a country enacts a tax policy that discourages investment, and the policy reduces the investment rate immediately and permanently from
> Read the article on institutions by Mancur Olson, cited in footnote 10. (You may be able to find it on the web by typing the author’s name and a few words from the title into Google Scholar.) The last sentence of that paper says that “individual rational
> Repeat exercise 5, but this time assume the production function is given by Y =
> The table below reports per capita GDP and capital per person in the year 2014 for 10 countries. Your task is to fill in the missing columns of the table. (a) Given the values in columns 1 and 2, fill in columns 3 and 4. That is, compute per capita GDP a
> Explain whether the following goods are rivalrous or nonrivalrous: (a) Beethoven’s Fifth Symphony, (b) a portable music player, (c) Monet’s painting Water Lilies, (d) the method of public key cryptography, (e) fish in the ocean.
> In 2014, Ethiopia had a per capita income of $1,500, about $4 per day. Compute per capita income in Ethiopia for the year 2050 assuming average annual growth is (a) 1% per year. (b) 2% per year. (c) 4% per year. (d) 6% per year. (For comparison, per capi
> Suppose the production function at the core of our model is given by Y = AK 3/4L 1/4 (that is, assume the exponents on capital and labor are 3/4 and 1/4 rather than 1/3 and 2/3). (a) Create a new version of Table 4.1 for the new version of
> What determines whether a curve shifts in the Solow diagram? Make a list of the parameters of the Solow model, and state whether a change in each parameter shifts a curve (which one?) or is simply a movement along both curves.
> What is the economic meaning of the vertical gap between the investment curve and the depreciation curve in the Solow diagram?
> Add another line, period 6, to Table 5.1. What are the values of K6, I6,
> What are some costs and benefits of economic growth?
> This question is not addressed in the chapter—and in fact is still debated among economists—but it is interesting to think about: Why do you suppose growth in living standards was virtually nonexistent for thousands of years? Why did this situation chang
> How does macroeconomics study these questions?
> Given your current knowledge, what do you think are the answers to these questions?
> By roughly how much did housing prices fall during the financial crisis? What about the stock market?
> Who pays the inflation tax?
> Write each production function given below in terms of output per person y ; Y/L and capital per person k ; K/L. Show what these “per person” versions look like in a graph with k on the horizontal axis and y on the vertical axis. (Assume
> Suppose the world population today is 7 billion, and suppose this population grows at a constant rate of 3% per year from now on. (This rate is almost certainly much faster than the future population growth rate; the high rate used here is useful for ped
> Explain how a rise in
> What is inflation? Suppose an individual’s retirement plan consists of putting $100 into a safe. What effect does inflation have on this plan?
> In the past 50 years, both the fraction of hours worked by college graduates and the relative wage of college graduates have gone up. Why?
> How are ideas different from objects? What are some examples of each?
> Which questions in macroeconomics interest you the most? Why?
> What justification can one give for a fiscal stimulus during the financial crisis?
> Throughout much of the 2010–2015 period, the fed funds rate was substantially lower than what a Taylor rule for monetary policy would seem to indicate. Why?
> What is the fundamental source of transition dynamics in our AS/AD framework? Why does the economy take several periods before returning to its steady state following a shock?
> What are some examples of shocks that shift the AD curve? What about the AS curve?
> How does a central bank influence economic activity in the short run?
> Do the following production functions exhibit increasing, constant, or decreasing returns to scale in K and L? (Assume
> Why is the relationship between output and the real interest rate called the “IS curve”?
> Why does the IS curve slope downward?
> What is a balance sheet? What is net worth?
> A Monetary History of the United States, 1867 to 1960, by Milton Friedman and Anna Schwartz, is a classic study of monetary policy and was published in 1963. Read the interview with Anna Schwartz available at www.minneapolisfed.org/publications/ the- reg
> What are some recent shocks that have hit the macroeconomy?
> How do the long- run model and the short- run model fit together? What is the purpose of each model?
> Explain some of the costs of hyperinflations. If they are so costly to an economy, why do they occur?
> The poorest countries in the world have a per capita income of about $600 today. We can reasonably assume that it is nearly impossible to live on an income below half this level (below $300). Per capita income in the United States in 2015 was about $51,0
> Make one change to the basic combined model that we studied in this appendix: let the production function for output be Yt = AtK1/4 t L3/4 yt . That is, we’ve reduced the exponent on capital and raised it on labor to preserve constant returns to objects.
> Growth in the combined Solow- Romer model is faster than growth in the Romer model. In what sense is this true? Why is it true?
> Suppose xt =(1.04)t and yt =(1.02)t. Calculate the growth rate of zt in each of the following cases: (a) z = xy (b) z = x/y (c) z = y/x (d) z = x1/2y1/2 (e) z =(x/y)2 (f) z = x-1/3y2/3
> Consider the following (made- up) statistics for some economies. Assume the exponent on capital is 1/3 and that the labor composition is unchanged. For each economy, compute the growth rate of TFP. (a) A European economy: gY/L = 0.03, gK/L = 0.03. (b) A
> Suppose the economy has a natural rate of unemployment of 5%. (a) Suppose short- run output over the next 4 years is +1%, 0%, −1%, and −2%. According to Okun’s law, what unemployment rates would we expect to see in this economy? (b) Consider another ec
> Japanese GDP in 2012 was 468 trillion yen (U.S. GDP was $16.2 trillion). The exchange rate in 2012 was 79.8 yen per dollar. Contrary to China and India, however, Japan had higher prices than the United States: the price level in Japan (converted to dolla
> The Fisher equation relates real (R) and nominal (i) interest rates to the rate of inflation (
> Suppose the Fed announces today that it is lowering the fed funds rate by 50 “basis points” (that is, by half a percentage point). Using the IS- MP diagram, explain what happens to economic activity in the short run. What is the economics underlying the
> Suppose velocity is constant, the growth rate of real GDP is 3% per year, and the growth rate of money is 5% per year. Calculate the long- run rate of inflation according to the quantity theory in each of the following cases: (a) What is the rate of inf
> Suppose scientists discover a new way to extract oil from deposits that were previously thought to be unrecoverable. The extra supply of oil leads oil prices to decline by $5 per barrel. Explain the effect on wages, the employment- population ratio, and
> Suppose the parameters of the IS curve are
> Consider the following simple monetary policy rule: Rt −
> Using the FRED database, download a graph of the share of income paid to labor for the nonfarm business sector of the U.S. economy, back to 1947. (For an introduction to FRED, see the case study “The FRED Database” in Chapter 2 on page 34.) (a) Display t
> Compute the average annual growth rate of per capita GDP in each of the cases below. The levels are provided for 1980 and 2014, measured in constant 2011 dollars.11 1980 2014 United States 29,288 51,958 Canada 24,716 43,376 France 22,557 37,360 Unit
> Create a new table that contains only the last three columns of the table in exercise 5. This time, instead of reporting the numbers relative to the U.S. value, report the inverse of these numbers. For example, you should have found that per capita GDP i
> When and where did sustained economic growth first begin? How much inequality in per capita income was there throughout the countries of the world a thousand years ago? How much is there today?
> Why are capital requirements an important part of any reform to improve the functioning of the financial system?
> Describe the Fed’s balance sheet in “normal” times. How did it change during the financial crisis? Why?
> What is deflation, and what problems does deflation pose for the macro economy? How does deflation interact with the zero lower bound for nominal interest rates?
> Why is the Great Recession best understood in the IS/ MP– Phillips curve framework instead of the AS/AD framework?
> What are financial frictions, and what role do such frictions play in the financial crisis? How does a financial friction enter the IS/MP diagram and the AS/AD framework?
> Why are inflation expectations so important to modern monetary policy? What are several ways that central banks try to manage inflation expectations?
> Why do inflation- output loops appear counterclockwise?
> Why does the AD curve slope downward? Why does the AS curve slope upward? How is the AS/AD graph like a standard supply- and- demand diagram? How is it different?
> Plot the following scenarios for per capita GDP on a ratio scale. Assume that per capita GDP in the year 2015 is equal to $10,000. You should not need a calculator or computer program. Use the Rule of 70 to label the value of per capita GDP on the graph

