Question: Write an SQL query to list the
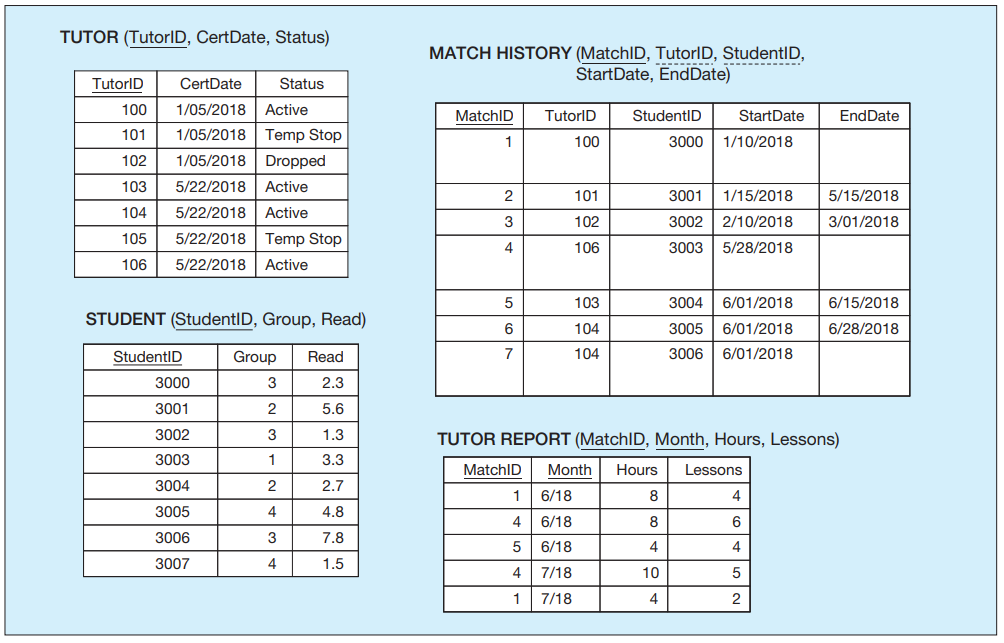
Write an SQL query to list the Read scores of students who were ever taught by tutors whose status is Dropped.
> Display in product ID order the product ID and total amount ordered of that product by the customer who has bought the most of that product; use a derived table in a FROM clause to answer this query.
> For each of the descriptions below, perform the following tasks: i. Identify the degree and cardinalities of each relationship. ii. Express the relationships in each description graphically with an E-R diagram. a. A book is identified by its ISBN number,
> Write an SQL query to list the salesperson who has sold the most computer desks.
> Write an SQL query to list the order number, product ID, and ordered quantity for all ordered products for which the ordered quantity is greater than the average ordered quantity for that product.
> List the IDs and names of those sales territories that have at least 50 percent more customers as the average number of customers per territory.
> List the IDs and names of all products that cost less than the average product price in their product line.
> Review the first query in the “Correlated Subqueries” section. Can you identify a special set of standard prices for which this query will not yield the desired result? How might you rewrite the query to handle this situation?
> Write an SQL query that lists the vendor ID, vendor name, material ID, material name, and supply unit prices for all those materials that are provided by more than one vendor.
> Display the customer names of all customers who have ordered (on the same or different orders) both products with IDs 3 and 4.
> Show the customer ID and name for all the customers who have ordered both products with IDs 3 and 4 on the same order.
> Display the customer ID, name, and order ID for all customer orders. For those customers who do not have any orders, include them in the display once by showing order ID 0.
> Rewrite your answer to Problem and Exercise 6-71 for each customer, not just customer 16. Data from Problem and Exercise 6-71: Display the name of customer 16 and the names of all the customers that are in the same zip code as customer 16.
> A cellular operator needs a database to keep track of its customers, their subscription plans, and the handsets (mobile phones) that they are using. The E-R diagram in Figure 2-24 illustrates the key entities of interest to the operator and the relations
> Display the name of customer 16 and the names of all the customers that are in the same zip code as customer 16.
> Display the EmployeeID and EmployeeName for those employees who do not possess the skill Router. Display the results in order by EmployeeName. Show how you constructed this query using a Venn or other type of diagram.
> Display the customer ID, name, and order ID for all customer orders. For those customers who do not have any orders, include them in the display once.
> Write an SQL query to produce a list of all the products (i.e., product description) and the number of times each product has been ordered. Show how you constructed this query using a Venn or other type of diagram.
> Display the names of the states in which customers reside but for which there is no salesperson residing in that state. There are several ways to write this query. Try to write it without any WHERE clause. Write this query two ways, using the set command
> Display the order IDs for customers who have not made any payment, yet, on that order. Use the set command UNION, INTERSECT, or MINUS in your query.
> The production manager at PVFC is concerned about support for purchased parts in products owned by customers. A simple analysis he wants done is to determine for each customer how many vendors are in the same state as that customer. Develop a list of all
> Write a query to list the number of products produced in each work center (label as TotalProducts). If a work center does not produce any products, display the result with a total of 0.
> Display the salesperson name, product finish, and total quantity sold (label as TotSales) for each finish by each salesperson.
> List, in alphabetical order, the names of all employees (managers) who are now managing people with skill ID BS12; list each manager’s name only once, even if that manager manages several people with this skill.
> Refer to the EER diagram for patients in Figure 3-3. Make any assumptions you believe are necessary. Develop sample definitions for each entity type, attribute, and relationship in the diagram. Data from Figure 3-3:
> Modify Problem and Exercise 6-60 so that the list includes the number of products each customer bought in each product line in March 2018. Data from Problem and Exercise 6-60: Modify Problem and Exercise 6-59 so that you include the number of products i
> Modify Problem and Exercise 6-59 so that you include the number of products in product line Basic that the customer ordered in March 2018. Data from Problem and Exercise 6-59: Write an SQL query to list each customer who bought at least one product that
> Write an SQL query to list each customer who bought at least one product that belongs to product line Basic in March 2018. List each customer only once.
> Write an SQL query to list each customer who has bought computer desks and the number of units sold to each customer. Show how you constructed this query using a Venn or other type of diagram.
> For every order that has been received, display the order ID, the total dollar amount owed on that order (you’ll have to calculate this total from attributes in one or more tables; label this result TotalDue), and the amount received in payments on that
> Calculate the total raw material cost (label TotCost) for each product compared to its standard product price. Display product ID, product description, standard price, and the total cost in the result.
> Write an SQL query that lists for each vendor (including vendor ID and vendor name) those materials that the vendor supplies where the supply unit prices is at least four times the material standard price.
> Write an SQL query to total the cost of order number 1.
> Write an SQL query that lists those work centers that employ at least one person who has the skill ‘QC1’.
> Write an SQL query to display the total number of employees working at each work center (include ID and location for each work center).
> Refer to the employee EER diagram in Figure 3-2. Make any assumptions that you believe are necessary. Develop a sample definition for each entity type, attribute, and relationship in the diagram. Data from Figure 3-2:
> Write an SQL query to display each item ordered for order number 1, its standard price, and the total price for each item ordered.
> Write an SQL query to display the order number, customer number, order date, and items ordered for some particular customer.
> List the name of each employee, his or her birth date, the name of his or her manager, and the manager’s birth date for those employees who were born before their manager was born; label the manager’s data Manager and ManagerBirth. Show how you construct
> List the names and number of employees supervised (label this value HeadCount) for each supervisor who supervises more than two employees.
> Modify P&E 6-46 to include only those product lines the average price of which is higher than $200. Data from P&E 6-46: Write an SQL query to list all product line names and, for each product line, the number of products and the average product price. M
> Write an SQL query to list all product line names and, for each product line, the number of products and the average product price. Make sure to include all product lines separately.
> This problem is based on the entire (“big” version) Pine Valley Furniture Company database. Write an SQL query that will find any customers who have not placed orders.
> Which tutor needs to be reminded to turn in reports? Write the SQL query. Show how you constructed this query using a Venn or other type of diagram.
> Which tutors, by name, are available to tutor? Write the SQL query.
> List the total number of lessons taught in 2018 by tutors in each of the three Status categories (Active, Temp Stop, and Dropped).
> For simplicity, subtype discriminators were left off many figures in this chapter. Add subtype discriminator notation in each figure listed below. If necessary, create a new attribute for the discriminator. a. Figure 3-2 b. Figure 3-3 c. Figure 3-4b d. F
> Match the following terms and definitions: - agile software development - database application - constraint - repository - metadata - data warehouse - information - user view - database management system - data independence - entity - enterprise resource
> For each student group, list the number of tutors who have been matched with that group.
> List all active students in June by name. (Make up names and other data if you are actually building a prototype database.) Include the number of hours students received tutoring and how many lessons they completed.
> Write an SQL query to determine the total number of hours and the total number of lessons Tutor 106 taught in June and July 2018.
> Where do you think student and tutor information such as name, address, phone, and e-mail should be kept? Write the necessary SQL commands to capture this information.
> Write the SQL query to find any tutors who have not submitted a report for July.
> Write a SQL query to identify all students who have been matched in 2018 with a tutor whose status is Temp Stop.
> What do you need to do if a tutor signs up and wants to tutor in both reading and math? Draw the new ERD, create new relations, and write any SQL statements that would be needed to handle this development.
> Write the SQL command to add column SUBJECT to TUTOR. The only values allowed for SUBJECT will be Reading, Math, and ESL.
> Write the SQL command to add column MATH SCORE to the STUDENT table.
> Add a subtype discriminator for each of the supertypes shown in Figure 3-10. Show the discriminator values that assign instances to each subtype. Use the following subtype discriminator names and values: a. PERSON: Person Type (Employee? Alumnus? Student
> Determine the relationships among the four relations in Figure. List primary keys for each relation and any foreign keys necessary to establish the relationships and maintain referential integrity. Pay particular attention to the data contained in TUTOR
> Write an SQL query to answer the following questions: a. Which students were not enrolled in any courses during semester I-2018? b. Which faculty members are not qualified to teach any courses?
> Write SQL queries to answer the following questions: a. What are the names of the course(s) that student Altvater took during the semester I-2018? b. List the names of the students who have taken at least one course that Professor Collins is qualified to
> Write SQL queries to answer the following questions: a. How many students were enrolled in section 2714 during semester I-2018? b. How many students were enrolled in ISM 3113 during semester I-2018?
> Write an SQL query to answer the following question: Is any instructor qualified to teach ISM 3113 and not qualified to teach ISM 4930? If yes, list the faculty ID and name of the instructor.
> Write SQL retrieval commands for each of the following queries: a. Display the course ID and course name for all courses with an ISM prefix. b. Display the numbers and names of all courses for which Professor Berndt has been qualified. c. Display the cla
> Write an SQL query to answer the following question: Which instructors are qualified to teach ISM 3113?
> Tyler Richardson set up a house alarm system when he moved to his new home in Seattle. For security purposes, he has all of his mail, including his alarm system bill, mailed to his local UPS store. Although the alarm system is activated and the company i
> Not all versions of this database include referential integrity constraints for all foreign keys. Use whatever commands are available for the RDBMS you are using, investigate if any referential integrity constraints are missing. Write any missing constra
> List the average number of customers per state (including only the states that are included in the Customer_T table). Hint: A query can be used as a table specification in the FROM clause.
> Examine the hierarchy for the university EER diagram. As a student, you are an instance of one of the subtypes: either UNDERGRAD STUDENT or GRADUATE STUDENT. List the names of all the attributes that apply to you. For each attribute, record the data valu
> For products 1, 2, and 7, list in one row and three respective columns that product’s total unit sales; label the three columns Prod1, Prod2, and Prod7.
> For each customer, list the customer ID, the number of orders from that customer, and the ratio of the number of orders from that customer to the total number of orders from all customers combined. (This ratio, of course, is the percentage of all orders
> For each order, list the order ID, customer ID, order date, and most recent date among all orders. Show how you constructed this query using a Venn diagram.
> List ProductID, ProductDescription, ProductFinish, and ProductStandardPrice for oak products with a ProductStandardPrice greater than $400 or cherry products with a StandardPrice less than $300. Show how you constructed this query using a Venn diagram.
> List MaterialName, Material, and Width for raw materials that are not cherry or oak and whose width is greater than 10 inches. Show how you constructed this query using a Venn diagram.
> For each salesperson, list the total number of orders by month for the year 2018. (Hint: If you are using Access, use the Month function. If you are using Oracle, convert the date to a string, using the TO_CHAR function, with the format string ‘Mon’ [i.e
> Display the SalesPersonID and a count of the number of orders for that salesperson for all salespersons except salespersons 3, 5, and 9. Write this query with as few clauses or components as possible, using the capabilities of SQL as much as possible.
> Display the territory ID and the number of salespersons in the territory for all territories that have more than one salesperson. Label the number of salespersons NumSalesPersons.
> Measured by average standard price, what is the least expensive product finish?
> For employees who live in TN or FL, list the age at which they were hired.
> Select a suitable programming language and outline how a transaction rollback can be coded. Annotate your code to provide clear instructions of what is happening.
> Which product is ordered most frequently?
> List all sales territories (TerritoryID) that have more than one salesperson.
> Assume that for those materials the ID of which starts with a numeric character, the last three letters of the ID represent a wood type. Further, assume that the numeric part of MaterialID (everything except the last three characters) is called material
> For each customer who had more than two orders, list the CustomerID and the total number of orders placed.
> For each salesperson, list the total number of orders.
> For each customer, list the customer ID and the total number of orders placed in 2018.
> For each payment made on or after March 10, 2018, list PaymentID, OrderID, PaymentAmount, and the first 10 characters of PaymentComment.
> Display the product ID and the number of orders placed for each product. Show the results in decreasing order by the number of times the product has been ordered and label this result column NumOrders.
> For each salesperson, display a list of CustomerIDs.
> For each customer, list the CustomerID and total number of orders placed.
> Rewrite the example shown in Figures 7-10 through 7-14 using Java. Data from Figure 7-10: Data from Figure 7-11: Data from Figure 7-12: Data from Figure 7-13: Data from Figure 7-14:
> For each order, display the order ID, the number of separate products included in the order, and the total number of product units (for all products) ordered.
> For every product that has been ordered, display the product ID and the total quantity ordered (label this result TotalOrdered). List the most popular product first and the least popular last.
> Modify query in P&E 5-67 by considering only those products the standard price of which is greater than $200. Include in the answer set only those product lines that have an average standard price of at least $500. Data from P&E 5-67: Display the produc
> Display the product line ID and the average standard price for all products in each product line.
> List the MaterialID, MaterialName, Material, MaterialStandardPrice, and Thickness for all raw materials made of cherry, pine, or walnut. Order the listing by Material, StandardPrice, and Thickness.
> List all raw materials that are made of cherry and that have dimensions (thickness and width) of 12 by 12.
> List the number of customers living at each state that is included in the Customer_T table.
> List the customers who live in California or Washington. Order them by zip code, from high to low.
> Which employees were hired during 2005?
> List the employees whose last names begin with an L.

