Question: A study by the University of Texas
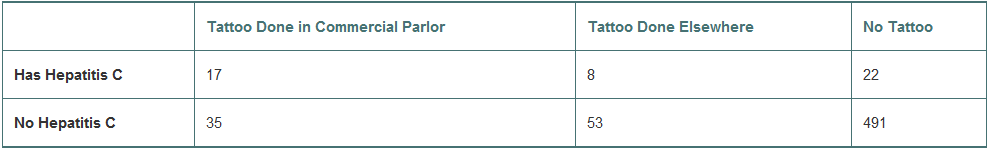
A study by the University of Texas Southwestern Medical Center examined 626 people to see if an increased risk of contracting hepatitis C was associated with having a tattoo. If the subject had a tattoo, researchers asked whether it had been done in a commercial tattoo parlor or elsewhere. Write a brief description of the association between tattooing and hepatitis C, including an appropriate graphical display.
> An online investment blogger advises investing in mutual funds that have performed badly the past year because regression to the mean tells us that they will do well next year. Is he correct?
> A CEO complains that the winners of his rookie junior executive of the year award often turn out to have less impressive performance the following year. He wonders whether the award actually encourages them to slack off. Can you offer a better explanatio
> Recall the data on disk drives we saw in Chapter 6, Exercise 4. Look at data on disk drives in the table below. Suppose we want to predict Price from Capacity. 1. Find the slope estimate, b1. 2. What does it mean, in this context? 3. Find the intercept,
> Recall the data we saw in Chapter 6, Exercise 3 for a bookstore. Below are data for a bookstore. The manager wants to predict Sales from Number of Sales People Working. 1. Find the slope estimate, b1 2. What does it mean, in this context? 3. Find the int
> A company must decide which of two delivery services it will contract with. During a recent trial period, the company shipped numerous packages with each service and kept track of how often deliveries did not arrive on time. Here are the data: 1. Compare
> The newborn grandson of one of the authors was 48 cm long and weighed 3 kg. According to the regression model of Exercise 3, what was his residual? What does that say about him?
> A least squares regression line was calculated to relate the length (cm) of newborn boys to their weight in kg. The line is weight^=5.94+0.1875 length. Explain in words what this model means. Should new parents (who tend to worry) be concerned if their n
> If false, explain briefly. 1. Some of the residuals from a least squares linear model will be positive and some will be negative. 2. Least squares means that some of the squares of the residuals are minimized. 3. We write y^ to denote the predicted value
> Here is a scatterplot of the residuals from the regression of the hard drive prices on their sizes from Exercise 6. 1. Are any assumptions or conditions violated? If so, which ones? 2. What would you recommend about this regression?
> Here are residual plots (residuals plotted against predicted values) for three linear regression models. Indicate which condition appears to be violated (Linearity, Outlier, or Equal Spread) in each case.
> For the hard drive data of Exercise 6, find and interpret the value of R2.
> For the regression model for the bookstore of Exercise 5, what is the value of R2 and what does it mean?
> Here are the residuals for a regression of Price on Capacity for the hard drives of Exercise 6 (based on the hand-computed coefficients). 1. Which residual contributes the most to the sum that is minimized by the least squares criterion? 2. Five of the r
> If false, explain briefly. 1. We choose the linear model that passes through the most data points on the scatterplot. 2. The residuals are the observed y-values minus the y-values predicted by the linear model. 3. Least squares means that the square of t
> A study finds that during blizzards, online sales are highly associated with the number of snow plows on the road; the more plows, the more online purchases. The director of an association of online merchants suggests that the organization should encoura
> Most patients who undergo surgery make routine recoveries and are discharged as planned. Others suffer excessive bleeding, infection, or other postsurgical complications and have their discharges from the hospital delayed. Suppose your city has a large h
> A larger firm is considering acquiring the bookstore of Exercise 3. An analyst for the firm, noting the relationship seen in Exercise 3, suggests that when they acquire the store they should hire more people because that will drive higher sales. Is his c
> If we assume that the conditions for correlation are met, which of the following are true? If false, explain briefly. 1. A correlation of 0.02 indicates a strong, positive association. 2. Standardizing the variables will make the correlation 0. 3. Adding
> If we assume that the conditions for correlation are met, which of the following are true? If false, explain briefly. 1. A correlation of 0.98 indicates a strong, negative association. 2. Multiplying every value of x by 2 will double the correlation. 3.
> Disk drives have been getting larger. Their capacity is now often given in terabytes (TB), where 1 TB=1000 gigabytes, or about a trillion bytes. A search of prices for external disk drives on Amazon.com in mid-2016 found the following data: 1. Prepare a
> Consider the following data from a small bookstore: 1. Prepare a scatterplot of Sales against Number of sales people working. 2. What can you say about the direction of the association? 3. What can you say about the form of the relationship? 4. What can
> Suppose you were to collect data for each pair of variables. You want to make a scatterplot. Which variable would you use as the explanatory variable and which as the response variable? Why? What would you expect to see in the scatterplot? Discuss the li
> Suppose you were to collect data for each pair of variables. You want to make a scatterplot. Which variable would you use as the explanatory variable and which as the response variable? Why? What would you expect to see in the scatterplot? Discuss the li
> Environmental Protection Agency (EPA) fuel economy estimates for automobile models tested recently predicted a mean of 24.8 mpg and a standard deviation of 6.2 mpg for highway driving. Assume that a Normal model can be applied. 1. Draw the model for auto
> The shoe size data for women has a mean of 38.46 and a standard deviation of 1.84. To convert to U.S. sizes, use USsize=EuroSize—0.7865−22.5. 1. What is the mean women shoe size for these respondents in U.S. units? 2. What is the standard deviation in
> In Chapter 2 (Exercise 16 ) we saw data on shoe sizes of students, reported in European sizes. For the men, the mean size wasis 44.65 with a standard deviation of 2.03. To convert euro shoe sizes to U.S. sizes for men, use the equation USsize=EuroSize—0.
> In Exercise 8 you were asked to compare the responses of college presidents and all U.S. adults to the question about the value of a college education. To examine that question further, we randomly scrambled the responses and created 15 new mosaic plots
> Suppose you were to collect data for each pair of variables. You want to make a scatterplot. Which variable would you use as the explanatory variable and which as the response variable? Why? What would you expect to see in the scatterplot? Discuss the li
> A company customer service hotline handles many calls relating to orders, refunds, and other issues. The company records indicate that the median length of calls to the hotline is 4.4 minutes with an IQR of 2.3 minutes. 1. If the company were to describe
> A company selling clothing on the Internet reports that the packages it ships have a median weight of 68 ounces and an IQR of 40 ounces. 1. The company plans to include a sales flyer weighing 4 ounces in each package. What will the new median and IQR be?
> An incoming freshman took her college placement exams in French and mathematics. In French, she scored 82 and in math 86. The overall results on the French exam had a mean of 72 and a standard deviation of 8, while the mean math score was 68, with a stan
> A town January high temperatures average 36 with a standard deviation of 10, while in July the mean high temperature is 74 and the standard deviation is 8. In which month is it more unusual to have a day with a high temperature of 55? Explain.
> People with z-scores above 2.5 on an IQ test are sometimes classified as geniuses. If IQ scores have a mean of 100 and a standard deviation of 15 points, what IQ score do you need to be considered a genius?
> The histogram shows the distribution of mean ACT composite scores for all Wisconsin public schools in 2015. 80.1% of the data points fall between one standard deviation below the mean and one standard deviation above the mean. 1. Give two reasons that a
> Corey has 4929 songs in his computer music library. The lengths of the songs have a mean of 242.4 seconds and standard deviation of 114.51 seconds. A Normal probability plot of the song lengths looks like this: 1. Do you think the distribution is Normal?
> The mean household income in the U.S. in 2014 was about $72,641 and the standard deviation was about $85,000. (The median income was $51,939.) If we used the Normal model for these incomes, 1. What would be the household income of the top 1%? 2. How conf
> The Mathematics section of the ACT test had a mean of 20.9 and an SD of 5.3 for the years 2013 2015. If these are well modeled by a Normal distribution, about what percent of students scored 1. over 31? 2. under 18? 3. between 18 and 31?
> Based on the Normal model N(100,15) describing IQ scores, what percent of people IQs would you expect to be 1. over 80? 2. under 90? 3. between 112 and 132?
> In Exercise 5 you were asked whether you thought the differences in political identification across diet preferences were real. To examine that question further, we randomly scrambled the students politics preferences and created 8 new bar charts of thes
> The Virginia Cooperative Extension reports that the mean weight of yearling Angus steers is 1152 pounds. Suppose that weights of all such animals can be described by a Normal model with a standard deviation of 84 pounds. What percent of steers weigh 1. o
> Suppose your statistics professor reports test grades as z-scores, and you got a score of 2.20 on an exam. 1. Write a sentence explaining what that means. 2. Your friend got a z-score of 1. If the grades satisfy the Nearly Normal Condition, about what pe
> One of the authors has an adopted grandson whose birth family members are very short. After examining him at his 2-year checkup, the boy pediatrician said that the z-score for his height relative to American 2-year-olds was 1.88. Write a sentence explain
> Some IQ tests are standardized to a Normal model, with a mean of 100 and a standard deviation of 15. 1. Draw the model for these IQ scores. Clearly label it, showing what the 68 95 99.7 Rule predicts. 2. In what interval would you expect the central 95%
> The mean score on the Stats exam was 75 points with a standard deviation of 5 points, and Gregor z-score was −2. How many points did he score?
> Here is a timeplot of each monthly load factor for domestic flights for 2000 to 2013 along with a lowess smooth. 1. Describe the patterns you see in this plot. 2. Do you expect the overall pattern to continue for another decade? Why or why not?
> The boxplots of exercise 6 show a single possible outlier. But that month in 2015 would not be an outlier in any of the other months in the display. Do you think it should still be considered an outlier? Explain your reasoning.
> Look at the boxplots by month in Exercise 5. The low outlier in April is for April of 2003. At that time, there was concern over the deadly SARS virus, which may have depressed international travel. Do you think the data for April 2003 should be set asid
> Here is a display of the domestic load factors by year through 2017: Discuss the patterns you see in this display.
> Here is a display of the international load factors by month for the period from 2002 to 2017: Discuss the patterns you see in this display.
> In a way, boxplots are the opposite of histograms. A histogram divides the number line into equal intervals and displays the number of data values in each interval. A boxplot divides the data into equal parts and displays the portion of the number line e
> The boxplot shows the fuel economy ratings for 67 model year 2012 subcompact cars. Some summary statistics are also provided. The extreme outlier is the Mitsubishi i-MiEV, an electric car whose electricity usage is equivalent to 112 miles per gallon. If
> We can also compare domestic load factors for September through March versus those for April through August: Compare and contrast what these histograms show.
> Here are the exoplanet distances of Exercise 11, re-expressed to the log scale: 1. Is this a better scale to understand these distances? 2. The low outlier is sol that is, it is the distance of the sun from the earth. Do you think it belongs with these d
> Discoveries of planets beyond our solar system have grown rapidly. Here is a histogram showing the distance (in light-years) from earth to stars that have known planets (as of 2016): Explain why it might be beneficial to re-express these distances.
> Here is a timeplot of the same domestic load factors as in Exercise 9, but this time with a different smoother (called a median smoother) applied. 1. What can you see in the time plot with the smoother that you might have missed in the original time plot
> The Research and Innovative Technology Administration of the Bureau of Transportation Statistics (www.TranStats.bts.gov/Data_Elements.aspx?Data=2) reports load factors (passenger-miles as a percentage of available seat-miles) for commercial airlines for
> Are the patterns seen in Exercises 5 and 6 relating diet to political opinion the same for men and women? Here are two contingency tables: 1. Are women or men more likely to be conservative carnivores? 2. Are liberal vegetarians more likely to be women o
> Here is a mosaic plot of the data from Exercise 1 on whether college provides value from a survey of U.S. adults and college presidents: 1. From the mosaic plot, about what percent of the respondents were college presidents? 2. Is it easy to see from the
> Here is a mosaic plot of the data on Fish consumption and Prostate cancer from the Step-by-Step Example on page 71. 1. From the mosaic plot, about what percent of all men in this survey were diagnosed with prostate cancer? 2. Are there more men who had c
> The table below shows the number of licensed U.S. drivers (in millions) by age and by sex in 2014. (www.fhwa.dot.gov/policyinformation/statistics.cfm) 1. What percent of total drivers are under 20? 2. What percent of total drivers are male? 3. Write a fe
> Here are the same data as in Exercise 5 but displayed differently: 1. Describe what this plot shows using the concept of a conditional distribution. 2. Do you think the differences here are real? Explain.
> The A survey of 299 undergraduate students from Exercise 86 in Chapter 2 (data in Student survey) asked about respondents diet preference (Carnivore, Omnivore, Vegetarian) and political alignment (Liberal, Moderate, Conservative). Here is a stacked bar c
> 1. Find the conditional distribution (in percent’s) of income distribution for those who do not cyber compare prices. 2. Find the conditional distribution (in percent’s) of incomes for shoppers who do cyber compare prices.
> Consider the survey data in Exercise 1. 1. What is the conditional distribution (in percents) of college presidents opinions about the value of college? 2. Find the conditional distribution of the opinions of U.S. adults when the categories are combined
> It has become common for shoppers to comparison shop using the Internet. Respondents to a Pew survey in 2013 who owned cell phones were asked whether they had, in the past 30 days, looked up the price of a product while they were in a store to see if the
> In a random sample of U.S. adults surveyed in December 2011, Pew Research asked how important it is to you personally to be successful in a high-paying career or profession. Here is a table reporting the responses. (Percentages may not add to 100% due to
> The Pew Research Center asked 2143 U.S. adults and 1055 college presidents to rate the job the higher education system is doing in providing value for the money spent by students and their families as Excellent, Good, Only Fair, or Poor. 1. What percent
> A study of body fat on 250 men collected measurements of 12 body parts as well as the percentage of body fat that the men carried. Here is a dot plot of their bicep circumferences (in inches). What does the dot plot say about the distribution of the size
> Here are the same histograms as in Exercise 7. However, the two groups of fatalities have been highlighted, and the corresponding bars in the Year histogram are also highlighted. 1. How many years are included in the highlighted bar in the Passenger car
> Here are two histograms showing the annual number of traffic fatalities in passenger cars. (NHTSA) One plots the years, and the other plots the fatalities. 1. There are gaps in the histogram for Year. What do they indicate? 2. Why are all the bars in the
> For a period of five years, physicians at McGill University Health Center followed more than 5000 adults over the age of 50. The researchers were investigating whether people taking a certain class of antidepressants (SSRIs) might be at greater risk of b
> Changing attitudes about marriage and families prompted Pew Research to ask how people felt about particular recent trends. (pewresearch.org/pubs/1802/decline-marriage-rise-new-families) For each trend, participants were asked whether the trend is a good
> The ratings of the 20 top-grossing movies in the years 2006, 2008, 2012, and 2014 are shown in the following bar charts. The pie charts show the same data but are unlabeled. Match each pie chart with the correct year. (Data extracted from Movies 06-15)
> The Motion Picture Association of America (MPAA) rates each film to designate the appropriate audience. The ratings are G, PG, PG-13, and R. The pie chart shows the MPAA ratings of the same 891 movies released in 2014 and 2015 as in Exercise 3. (Data ext
> The pie chart summarizes the genres of the 891 MPAA rated movies released in 2014 and 2015. (Data extracted from Movies 06-15) 1. Is this an appropriate display for the genres? Why or why not? 2. Which category was least common?
> For the shoe sizes in Exercise 16, what might be the problem with either the standard deviation or the IQR as a measure of spread?
> For the bicep measurements in Exercise 10, would you report the standard deviation or the IQR? Explain briefly.
> For the number of adoptions in Exercise 12, 1. Would you report the standard deviation or the IQR? 2. Justify your answer briefly.
> For the 190 life expectancies in Exercise 15, 1. Would you report the standard deviation or the IQR? 2. Justify your answer briefly.
> For the shoe sizes in Exercise 16, what might be the problem with either the mean or the median as a measure of center?
> The frequencies of traffic fatalities of non-occupants of vehicles are shown in the following bar chart. (www.the-numbers.com/research-analysis) Change this to a bar chart of relative frequencies.
> Hearing anecdotal reports that some patients undergoing treatment for the eating disorder anorexia seemed to be responding positively to the antidepressant Prozac, medical researchers conducted an experiment to investigate. They found 93 women being trea
> For the bicep measurements in Exercise 10, would you report the mean, the median, or both? Explain briefly.
> For the number of adoptions in Exercise 12, 1. Which would you expect to be larger: the median or the mean? Explain briefly. 2. Which would you report: the mean or the median? Explain briefly.
> For the 146 life expectancies in Exercise 15, 1. Which would you expect to be larger: the median or the mean? Explain briefly. 2. Which would you report: the mean or the median? Explain briefly.
> A last is a form, traditionally made of wood, in the shape of the human foot. Lasts of various sizes are used by shoemakers to make shoes. In the United States, shoe sizes are defined differently for men and women: U.S. men shoe size =(last size in inche
> Here are the life expectancies at birth in 190 countries (2014) as collected by the World Health Organization. 1. Describe the shape. 2. How many modes do you see?
> For the distribution of e-mails sent by students in Exercise 11, describe the shape.
> Describe the shape of the distribution of bicep circumferences (in inches) for the 250 men in the study of Exercise 10.
> The U.S. Census Bureau keeps track of the number of adoptions in each state (and Washington, DC). (www.census.gov) The upper histogram shows the distribution of adoptions. The lower histogram shows the population of each state (and DC). 1. What do the hi
> A university teacher saved every e-mail received from students in a large introductory statistics class during an entire term. He then counted, for each student who had sent him at least one e-mail, how many e-mails each student had sent. What does the h
> The study in Exercise 9 actually measured the bicep circumference in centimeters. The dot plot in Exercise 9 was formed by dividing each measurement by 2.54 to convert it to inches. Here is the dot plot of the original values in cm. Do the two dot plots
> The Centers for Disease Control and Prevention (CDC) has estimated that 19.8% of Americans over 15 years old are obese. The CDC conducts a survey on obesity and various behaviors. Here is a table on self-reported exercise classified by body mass index (B
> The table gives the numbers of passenger car occupants killed in accidents in 2011 by car type. Convert this table to a relative frequency table.
> Load the Indy 500 2018 data into your preferred statistics package and answer the following questions: 1. What was the average speed of the winner in 1920? 2. How many times did Bill Vukovich win the race in the 1950s? 3. How many races took place during
> Load the Kentucky Derby 2018 data into your preferred statistics package and answer the following questions; 1. What was the name of the winning horse in 1880? 2. When did the length of the race change? 3. What was the winning time in 1974? 4. Only one h
> The 2.5-mile Indianapolis Motor Speedway has been the home to a race on Memorial Day nearly every year since 1911. Even during the first race, there were controversies. Ralph Mulford was given the checkered flag first but took three extra laps just to ma
> The Kentucky Derby is a horse race that has been run every year since 1875 at Churchill Downs in Louisville, Kentucky. The race started as a 1.5-mile race, but in 1896, it was shortened to 1.25 miles because experts felt that 3-year-old horses shouldn’t
> People who get lost in the desert, mountains, or woods often seem to wander in circles rather than walk in straight lines. To see whether people naturally walk in circles in the absence of visual clues, researcher Andrea Axtell tested 32 people on a foot
> In 2013, Consumer Reports published an article evaluating refrigerators. It listed 353 models, giving the brand, cost, size (cu ft), type (such as top freezer), estimated annual energy cost, an overall rating (good, excellent, etc.), and the repair histo

