Question: The U.S. Census Bureau keeps track
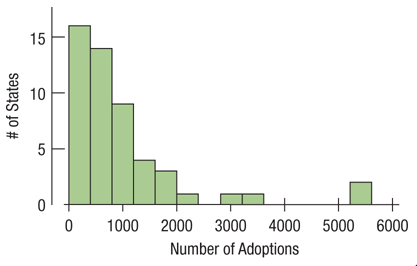
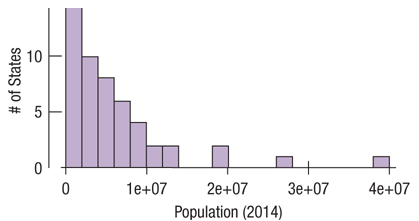
The U.S. Census Bureau keeps track of the number of adoptions in each state (and Washington, DC). (www.census.gov) The upper histogram shows the distribution of adoptions. The lower histogram shows the population of each state (and DC).
1. What do the histograms say about the distributions?
2. Why do think they look similar?
3. What might be a better way to express the number of adoptions?
> One of the authors has an adopted grandson whose birth family members are very short. After examining him at his 2-year checkup, the boy pediatrician said that the z-score for his height relative to American 2-year-olds was 1.88. Write a sentence explain
> Some IQ tests are standardized to a Normal model, with a mean of 100 and a standard deviation of 15. 1. Draw the model for these IQ scores. Clearly label it, showing what the 68 95 99.7 Rule predicts. 2. In what interval would you expect the central 95%
> The mean score on the Stats exam was 75 points with a standard deviation of 5 points, and Gregor z-score was −2. How many points did he score?
> Here is a timeplot of each monthly load factor for domestic flights for 2000 to 2013 along with a lowess smooth. 1. Describe the patterns you see in this plot. 2. Do you expect the overall pattern to continue for another decade? Why or why not?
> The boxplots of exercise 6 show a single possible outlier. But that month in 2015 would not be an outlier in any of the other months in the display. Do you think it should still be considered an outlier? Explain your reasoning.
> Look at the boxplots by month in Exercise 5. The low outlier in April is for April of 2003. At that time, there was concern over the deadly SARS virus, which may have depressed international travel. Do you think the data for April 2003 should be set asid
> Here is a display of the domestic load factors by year through 2017: Discuss the patterns you see in this display.
> Here is a display of the international load factors by month for the period from 2002 to 2017: Discuss the patterns you see in this display.
> A study by the University of Texas Southwestern Medical Center examined 626 people to see if an increased risk of contracting hepatitis C was associated with having a tattoo. If the subject had a tattoo, researchers asked whether it had been done in a co
> In a way, boxplots are the opposite of histograms. A histogram divides the number line into equal intervals and displays the number of data values in each interval. A boxplot divides the data into equal parts and displays the portion of the number line e
> The boxplot shows the fuel economy ratings for 67 model year 2012 subcompact cars. Some summary statistics are also provided. The extreme outlier is the Mitsubishi i-MiEV, an electric car whose electricity usage is equivalent to 112 miles per gallon. If
> We can also compare domestic load factors for September through March versus those for April through August: Compare and contrast what these histograms show.
> Here are the exoplanet distances of Exercise 11, re-expressed to the log scale: 1. Is this a better scale to understand these distances? 2. The low outlier is sol that is, it is the distance of the sun from the earth. Do you think it belongs with these d
> Discoveries of planets beyond our solar system have grown rapidly. Here is a histogram showing the distance (in light-years) from earth to stars that have known planets (as of 2016): Explain why it might be beneficial to re-express these distances.
> Here is a timeplot of the same domestic load factors as in Exercise 9, but this time with a different smoother (called a median smoother) applied. 1. What can you see in the time plot with the smoother that you might have missed in the original time plot
> The Research and Innovative Technology Administration of the Bureau of Transportation Statistics (www.TranStats.bts.gov/Data_Elements.aspx?Data=2) reports load factors (passenger-miles as a percentage of available seat-miles) for commercial airlines for
> Are the patterns seen in Exercises 5 and 6 relating diet to political opinion the same for men and women? Here are two contingency tables: 1. Are women or men more likely to be conservative carnivores? 2. Are liberal vegetarians more likely to be women o
> Here is a mosaic plot of the data from Exercise 1 on whether college provides value from a survey of U.S. adults and college presidents: 1. From the mosaic plot, about what percent of the respondents were college presidents? 2. Is it easy to see from the
> Here is a mosaic plot of the data on Fish consumption and Prostate cancer from the Step-by-Step Example on page 71. 1. From the mosaic plot, about what percent of all men in this survey were diagnosed with prostate cancer? 2. Are there more men who had c
> The table below shows the number of licensed U.S. drivers (in millions) by age and by sex in 2014. (www.fhwa.dot.gov/policyinformation/statistics.cfm) 1. What percent of total drivers are under 20? 2. What percent of total drivers are male? 3. Write a fe
> Here are the same data as in Exercise 5 but displayed differently: 1. Describe what this plot shows using the concept of a conditional distribution. 2. Do you think the differences here are real? Explain.
> The A survey of 299 undergraduate students from Exercise 86 in Chapter 2 (data in Student survey) asked about respondents diet preference (Carnivore, Omnivore, Vegetarian) and political alignment (Liberal, Moderate, Conservative). Here is a stacked bar c
> 1. Find the conditional distribution (in percent’s) of income distribution for those who do not cyber compare prices. 2. Find the conditional distribution (in percent’s) of incomes for shoppers who do cyber compare prices.
> Consider the survey data in Exercise 1. 1. What is the conditional distribution (in percents) of college presidents opinions about the value of college? 2. Find the conditional distribution of the opinions of U.S. adults when the categories are combined
> It has become common for shoppers to comparison shop using the Internet. Respondents to a Pew survey in 2013 who owned cell phones were asked whether they had, in the past 30 days, looked up the price of a product while they were in a store to see if the
> In a random sample of U.S. adults surveyed in December 2011, Pew Research asked how important it is to you personally to be successful in a high-paying career or profession. Here is a table reporting the responses. (Percentages may not add to 100% due to
> The Pew Research Center asked 2143 U.S. adults and 1055 college presidents to rate the job the higher education system is doing in providing value for the money spent by students and their families as Excellent, Good, Only Fair, or Poor. 1. What percent
> A study of body fat on 250 men collected measurements of 12 body parts as well as the percentage of body fat that the men carried. Here is a dot plot of their bicep circumferences (in inches). What does the dot plot say about the distribution of the size
> Here are the same histograms as in Exercise 7. However, the two groups of fatalities have been highlighted, and the corresponding bars in the Year histogram are also highlighted. 1. How many years are included in the highlighted bar in the Passenger car
> Here are two histograms showing the annual number of traffic fatalities in passenger cars. (NHTSA) One plots the years, and the other plots the fatalities. 1. There are gaps in the histogram for Year. What do they indicate? 2. Why are all the bars in the
> For a period of five years, physicians at McGill University Health Center followed more than 5000 adults over the age of 50. The researchers were investigating whether people taking a certain class of antidepressants (SSRIs) might be at greater risk of b
> Changing attitudes about marriage and families prompted Pew Research to ask how people felt about particular recent trends. (pewresearch.org/pubs/1802/decline-marriage-rise-new-families) For each trend, participants were asked whether the trend is a good
> The ratings of the 20 top-grossing movies in the years 2006, 2008, 2012, and 2014 are shown in the following bar charts. The pie charts show the same data but are unlabeled. Match each pie chart with the correct year. (Data extracted from Movies 06-15)
> The Motion Picture Association of America (MPAA) rates each film to designate the appropriate audience. The ratings are G, PG, PG-13, and R. The pie chart shows the MPAA ratings of the same 891 movies released in 2014 and 2015 as in Exercise 3. (Data ext
> The pie chart summarizes the genres of the 891 MPAA rated movies released in 2014 and 2015. (Data extracted from Movies 06-15) 1. Is this an appropriate display for the genres? Why or why not? 2. Which category was least common?
> For the shoe sizes in Exercise 16, what might be the problem with either the standard deviation or the IQR as a measure of spread?
> For the bicep measurements in Exercise 10, would you report the standard deviation or the IQR? Explain briefly.
> For the number of adoptions in Exercise 12, 1. Would you report the standard deviation or the IQR? 2. Justify your answer briefly.
> For the 190 life expectancies in Exercise 15, 1. Would you report the standard deviation or the IQR? 2. Justify your answer briefly.
> For the shoe sizes in Exercise 16, what might be the problem with either the mean or the median as a measure of center?
> The frequencies of traffic fatalities of non-occupants of vehicles are shown in the following bar chart. (www.the-numbers.com/research-analysis) Change this to a bar chart of relative frequencies.
> Hearing anecdotal reports that some patients undergoing treatment for the eating disorder anorexia seemed to be responding positively to the antidepressant Prozac, medical researchers conducted an experiment to investigate. They found 93 women being trea
> For the bicep measurements in Exercise 10, would you report the mean, the median, or both? Explain briefly.
> For the number of adoptions in Exercise 12, 1. Which would you expect to be larger: the median or the mean? Explain briefly. 2. Which would you report: the mean or the median? Explain briefly.
> For the 146 life expectancies in Exercise 15, 1. Which would you expect to be larger: the median or the mean? Explain briefly. 2. Which would you report: the mean or the median? Explain briefly.
> A last is a form, traditionally made of wood, in the shape of the human foot. Lasts of various sizes are used by shoemakers to make shoes. In the United States, shoe sizes are defined differently for men and women: U.S. men shoe size =(last size in inche
> Here are the life expectancies at birth in 190 countries (2014) as collected by the World Health Organization. 1. Describe the shape. 2. How many modes do you see?
> For the distribution of e-mails sent by students in Exercise 11, describe the shape.
> Describe the shape of the distribution of bicep circumferences (in inches) for the 250 men in the study of Exercise 10.
> A university teacher saved every e-mail received from students in a large introductory statistics class during an entire term. He then counted, for each student who had sent him at least one e-mail, how many e-mails each student had sent. What does the h
> The study in Exercise 9 actually measured the bicep circumference in centimeters. The dot plot in Exercise 9 was formed by dividing each measurement by 2.54 to convert it to inches. Here is the dot plot of the original values in cm. Do the two dot plots
> The Centers for Disease Control and Prevention (CDC) has estimated that 19.8% of Americans over 15 years old are obese. The CDC conducts a survey on obesity and various behaviors. Here is a table on self-reported exercise classified by body mass index (B
> The table gives the numbers of passenger car occupants killed in accidents in 2011 by car type. Convert this table to a relative frequency table.
> Load the Indy 500 2018 data into your preferred statistics package and answer the following questions: 1. What was the average speed of the winner in 1920? 2. How many times did Bill Vukovich win the race in the 1950s? 3. How many races took place during
> Load the Kentucky Derby 2018 data into your preferred statistics package and answer the following questions; 1. What was the name of the winning horse in 1880? 2. When did the length of the race change? 3. What was the winning time in 1974? 4. Only one h
> The 2.5-mile Indianapolis Motor Speedway has been the home to a race on Memorial Day nearly every year since 1911. Even during the first race, there were controversies. Ralph Mulford was given the checkered flag first but took three extra laps just to ma
> The Kentucky Derby is a horse race that has been run every year since 1875 at Churchill Downs in Louisville, Kentucky. The race started as a 1.5-mile race, but in 1896, it was shortened to 1.25 miles because experts felt that 3-year-old horses shouldn’t
> People who get lost in the desert, mountains, or woods often seem to wander in circles rather than walk in straight lines. To see whether people naturally walk in circles in the absence of visual clues, researcher Andrea Axtell tested 32 people on a foot
> In 2013, Consumer Reports published an article evaluating refrigerators. It listed 353 models, giving the brand, cost, size (cu ft), type (such as top freezer), estimated annual energy cost, an overall rating (good, excellent, etc.), and the repair histo
> The Environmental Protection Agency (EPA) tracks fuel economy of automobiles based on information from the manufacturers (Ford, Toyota, etc.). Among the data the agency collects are the manufacturer, vehicle type (car, SUV, etc.), weight, horsepower, and
> In performing research for an ecology class, students at a college in upstate New York collect data on streams each year. They record a number of biological, chemical, and physical variables, including the stream name, the substrate of the stream (limest
> Business analysts hoping to provide information helpful to American grape growers compiled these data about vineyards: size (acres), number of years in existence, state, varieties of grapes grown, average case price, gross sales, and percent profit.
> A company held a blood pressure screening clinic for its employees. The results are summarized in the table below by Age and Blood pressure: 1. Find the marginal distribution of blood pressure level. 2. Find the conditional distribution of blood pressure
> Scientists at a major pharmaceutical firm conducted an experiment to study the effectiveness of an herbal compound to treat the common cold. They exposed each patient to a cold virus, then gave them either the herbal compound or a sugar solution known to
> In a study appearing in the journal Science, a research team reports that plants in southern England are flowering earlier in the spring. Records of the first flowering dates for 385 species over a period of 47 years show that flowering has advanced an a
> Medical researchers at a large city hospital investigating the impact of prenatal care on newborn health collected data from 882 births during 1998 2000. They kept track of the mother age, the number of weeks the pregnancy lasted, the type of birth (cesa
> The Gallup Poll conducted a representative telephone survey of 1180 American voters during the first quarter of 2007. Among the reported results were the voter region (Northeast, South, etc.), age, party affiliation, and whether or not the person had vot
> A listing posted by the Arby restaurant chain gives, for each of the sandwiches it sells, the type of meat in the sandwich, the number of calories, and the serving size in ounces. The data might be used to assess the nutritional value of the different sa
> The State Education Department requires local school districts to keep these records on all students: age, race or ethnicity, days absent, current grade level, standardized test scores in reading and mathematics, and any disabilities or special education
> Because of the difficulty of weighing a bear in the woods, researchers caught and measured 54 bears, recording their weight, neck size, length, and sex. They hoped to find a way to estimate weight from the other, more easily determined quantities.
> The Cleveland Casting Plant is a large, highly automated producer of gray and nodular iron automotive castings for Ford Motor Company. The company is interested in keeping the pouring temperature of the molten iron (in degrees Fahrenheit) close to the sp
> A look at 474 participants in the San Antonio Longitudinal Study of Aging found that participants who drank two or more diet sodas a day experienced waist size increases six times greater than those of people who didn’t drink diet soda. (J Am Geriatr Soc
> A study begun in 2011 examines the use of stem cells in treating two forms of blindness, Stargardt disease and dry age-related macular degeneration. Each of the 24 patients entered one of two separate trials in which embryonic stem cells were to be used
> In 2000, the Journal of the American Medical Association (JAMA) published a study that examined pregnancies that resulted in the birth of twins. Births were classified as preterm with intervention (induced labor or cesarean), preterm without procedures,
> Coffee stations in offices often just ask users to leave money in a tray to pay for their coffee, but many people cheat. Researchers at Newcastle University alternately taped two posters over the coffee station. During one week, it was a picture of flowe
> Some companies offer 401(k) retirement plans to employees, permitting them to shift part of their before-tax salaries into investments such as mutual funds. Employers typically match 50% of the employees contribution up to about 6% of salary. One company
> Ian Walker, a psychologist at the University of Bath, wondered whether drivers treat bicycle riders differently when they wear helmets. He rigged his bicycle with an ultrasonic sensor that could measure how close each car was that passed him. He then rod
> The hula-hoop, a popular children toy in the 1950s, has gained popularity as an exercise in recent years. But does it work? To answer this question, the American Council on Exercise conducted a study to evaluate the cardio and calorie-burning benefits of
> A study conducted by a team of American and Canadian researchers found that during ovulation, a woman can tell whether a man is gay or straight by looking at his face. To explore the subject, the authors conducted three investigations, the first of which
> Find an Internet source that reports on a study and describes the data. Print out the description and identify as many of the W as you can.
> Find a newspaper or magazine article in which some data are reported. For the data discussed in the article, identify as many of the W as you can. Include a copy of the article with your report.
> Meteorologists utilize sophisticated models to predict the weather up to ten days in advance. Give an example of how they might assess their models.
> Pollsters are interested in predicting the outcome of elections. Give an example of how they might model whether someone is likely to vote.
> A medical researcher measures the increase in heart rate of patients who are taking a stress test. What kind of variable is the researcher studying?
> Just how accurate are the weather forecasts we hear every day? The following table compares the daily forecast with a city actual weather for a year: 1. On what percent of days did it actually rain? 2. On what percent of days was rain predicted? 3. What
> A pharmaceutical company conducts an experiment in which a subject takes 100 mg of a substance orally. The researchers measure how many minutes it takes for half of the substance to exit the bloodstream. What kind of variable is the company studying?
> A June 2011 Gallup Poll asked Americans, Thinking about the job situation in America today, would you say that it is now a good time or a bad time to find a quality job? The choices were Good time or Bad time. What kind of variable is the response?
> A February 2010 Gallup Poll question asked, In politics, as of today, do you consider yourself a Republican, a Democrat, or an Independent? The possible responses were Democrat, Republican ,Independent ,Other , and No Response. What kind of variable is
> The U.S. Postal Service uses five-digit ZIP codes to identify locations to assist in delivering mail. 1. In what sense are ZIP codes categorical? 2. Is there any ordinal sense to ZIP codes? In other words, does a higher ZIP code tell you anything about a
> A person grade in school is generally identified by a number. 1. Give an example of a Why in which grade level is treated as categorical. 2. Give an example of a Why in which grade level is treated as quantitative.
> The Paralyzed Veterans of America (PVA) is a Congressionally chartered veterans service organization that represents the interests of paralyzed veterans. The agency provides a range of services to veterans who have spinal cord injury or dysfunction. It d
> In the text you have examined data in the file Body fat. In particular, you made regression models to predict %Body Fat from Waist size. But there are many other variables in the file. Using the statistics program of your choice, examine the ability of o
> The Belmont Stakes is the last and longest of the three horse races that make up the Triple Crown. Curiously, some of the Belmont races have been run clockwise around the track, and others have been run counterclockwise. Do the horses care? Here are boxp
> Over the course of the modern Olympics, France, Italy, and Great Britain have participated in roughly the same number of Olympic games. But is the distribution of their medals the same, or do they differ? Here is a table summarizing their Summer Olympic
> Archery is one of the few Olympic sports in which men and women compete on an equal footing. Both contests start with 64 archers, and the competitors first launch 72 arrows at a distance of 70 m from the target to establish seeding for their elimination
> A survey of autos parked in student and staff lots at a large university classified the brands by country of origin, as seen in the table. 1. What percent of all the cars surveyed were foreign? 2. What percent of the American cars were owned by students?
> For each of the following, list the sample space and tell whether you think the events are equally likely: 1. Roll two dice; record the sum of the numbers. 2. A family has 3 children; record each child sex in order of birth. 3. Toss four coins; record th
> The data set Igf contains measurements on people of various ages. The main variable of interest is the level of insulin-like growth factor (igÆ’) (J. Clin. Endocrinol. Metab. 78(3): 744752, March 1994). Each row in the data
> Manufacturing Inc. purchased a machine on 1 January 20X2 for $500,000. The estimated physical life of the machine is 15 years, but the estimated useful life to Manufacturing is 10 years. The equipment has an estimated residual value of $20,000. The equip
> Accounting for depreciation is substantially different between IFRS and ASPE. 2. Accounting for impairments is substantially different between IFRS and ASPE. 3. IFRS requires that all significant components must be depreciated if practical to do so. 4

