Question: An individual stock is selected at random
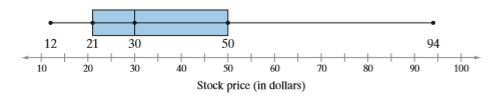
An individual stock is selected at random from the portfolio represented by the box-and-whisker plot shown. Find the probability that the stock price is
a. less than $21,
b. between $21 and $50, and
c. $30 or more.
Transcribed Image Text:
12 21 30 50 94 + 10 20 30 40 50 60 70 80 90 100 Stock price (in dollars)
> Display the data below in a pie chart. Describe the differences in how the Pareto chart and the pie chart show patterns in the data. Favorite Day of the Week Day Number of people Sun.- "uns Wed. Tues. Mon.
> Identify the sampling technique used, and discuss potential sources of bias (if any). Explain. Every tenth person entering a mall is asked to name his or her favorite store.
> Identify the sampling technique used, and discuss potential sources of bias (if any). Explain. After a hurricane, a disaster area is divided into 200 equal grids. Thirty of the grids are selected, and every occupied household in the grid is interviewed t
> Identify the sampling technique used, and discuss potential sources of bias (if any). Explain. Questioning university students as they leave a fraternity party, a researcher asks 463 students about their study habits.
> Identify the sampling technique used, and discuss potential sources of bias (if any). Explain. Selecting employees at random from an employee directory, researchers contact 300 people and ask what obstacles (such as computer problems) keep them from acco
> Volunteers for an experiment are numbered from 1 to 90. The volunteers are to be randomly assigned to two different treatment groups. Use a random number generator different from the one you used in Exercise 21 to choose 45 subjects for the treatment gro
> A researcher wants to study the effects of sleep deprivation on motor skills. Eighteen people volunteer for the experiment: Jake, Maria, Mike, Lucy, Ron, Adam, Bridget, Carlos, Steve, Susan, Vanessa, Rick, Dan, Kate, Pete, Judy, Mary, and Connie. Use a r
> Researchers in Germany tested the effect of a dietary supplement designed to control metabolism in patients with type 2 diabetes. Thirty-one patients with type 2 diabetes completed the study. The patients were assigned at random either the supplement or
> What is the difference between a census and a sampling?
> A pharmaceutical company wants to test the effectiveness of a new drug used to treat migraine headaches. The company identifies 500 females ages 25 to 45 years old who suffer from migraine headaches. The subjects are randomly assigned into two groups. On
> Determine the level of measurement of the data set. Explain your reasoning. The lengths (in seconds) of songs on an album are listed. 228 233 268 265 252 335 103 338 252 371 586 290 532 282
> Display the data below in a Pareto chart. Describe the differences in how the pie chart and the Pareto chart show patterns in the data. Favorite Season of U.S. Adults Ages 18 and Older Winter 8% Summer 26% Spring 26% Fall 40%
> Determine the level of measurement of the data set. Explain your reasoning. The flight numbers of 21 departing flights from Chicago O’Hare International Airport on an afternoon in October of 2016 are listed. 6827 3133 1785 5159 4509
> Use the tenth row of Table 1 in Appendix B to generate 10 random numbers between 1 and 920. 42103 02781 73920 56297 72678 12249 25270 36678 21313 75767
> Use the sixth row of Table 1 in Appendix B to generate 12 random numbers between 1 and 99. 28703 51709 94456 48396 73780 06436 86641 69239 57662 80181
> Determine whether the study is an observational study or an experiment. Explain. In a study designed to research the effect of music on driving habits, 1000 motorists ages 17–25 years old were asked whether the music they listened to influenced their dri
> Determine whether the study is an observational study or an experiment. Explain. To study the effects of social media on teenagers’ brains, researchers showed a few dozen teenagers photographs that had varying numbers of “likes” while scanning the reacti
> Determine whether the study is an observational study or an experiment. Explain. Researchers demonstrated that adults using an intensive program to lower systolic blood pressure to less than 120 millimeters of mercury reduce the risk of death from all ca
> Determine whether the study is an observational study or an experiment. Explain. In a survey of 1033 U.S. adults, 51% said U.S. presidents should release all medical information that might affect their ability to serve.
> Determine whether the statement is true or false. If it is false, rewrite it as a true statement. To select a cluster sample, divide a population into groups and then select all of the members in at least one (but not all) of the groups.
> What is the difference between an observational study and an experiment?
> Determine whether the data are qualitative or quantitative. Explain your reasoning. Hair colors of classmates
> Display the data below in a dot plot. Describe the differences in how the stem-and-leaf plot and the dot plot show patterns in the data. Phone Screen Sizes (in inches) 5 |00 5 55 5 6 7 8 8 9 6 000 123 4 4 655 6 8 8 9 70 Key: 5|0 = 5.0
> Determine whether the data are qualitative or quantitative. Explain your reasoning. Carrying capacities of flatbed trucks
> Determine whether the data are qualitative or quantitative. Explain your reasoning. Weights of dogs at an animal rescue facility
> Determine whether the statement is true or false. If it is false, rewrite it as a true statement. Data at the ratio level cannot be put in order.
> Determine whether the statement is true or false. If it is false, rewrite it as a true statement. More types of calculations can be performed with data at the nominal level than with data at the interval level.
> Determine whether the statement is true or false. If it is false, rewrite it as a true statement. For data at the interval level, you cannot calculate meaningful differences between data entries.
> Determine whether the number describes a population parameter or a sample statistic. Explain your reasoning. A survey of 1058 college board members found that 56.3% think that college completion is a major priority or the most important priority for thei
> Determine whether the number describes a population parameter or a sample statistic. Explain your reasoning. The average salary for 45 of a consulting firm’s 300 engineers is $72,000.
> Identify the population and the sample. Describe the sample data set. A survey of 1060 parents of 13- to 17-year-olds found that 636 of the 1060 parents have checked their teen’s social media profile.
> Identify the population and the sample. Describe the sample data set. To gather information about starting salaries at companies listed in the Standard & Poor’s 500, a researcher contacts 54 of the 500 companies.
> Determine whether the data are qualitative or quantitative, and determine the level of measurement of the data set. The numbers of performances for the 10 longest-running Broadway shows at the end of the 2016 season are listed. 11,782 6137 8107 5959
> Display the data below in a stem-and-leaf plot. Describe the differences in how the dot plot and the stem-and-leaf plot show patterns in the data. Heights of Players on a College Basketball Team 82 72 74 76 78 80 84 Inches
> Determine whether the data are qualitative or quantitative, and determine the level of measurement of the data set. The top ten highest grossing worldwide concert tours for 2016 are listed. 1. Bruce Springsteen & the E Street Band 2. Beyoncé 3. Cold
> Determine whether the data are qualitative or quantitative, and determine the level of measurement of the data set. The scores for the gold medal winning diver in the men’s 10-meter platform event from the 2016 Summer Olympics are liste
> Determine whether the statement is true or false. If it is false, rewrite it as a true statement. Data at the ordinal level are quantitative only.
> Determine whether the data are qualitative or quantitative, and determine the level of measurement of the data set. The regions representing the top salespeople in a corporation for the past six years are listed. Southeast Northeast Southwest Northwe
> Determine whether the data are qualitative or quantitative, and determine the level of measurement of the data set. The three political parties in the 114th Congress are listed. Republican Democrat Independent
> Determine whether the data are qualitative or quantitative, and determine the level of measurement of the data set. The top ten teams in the final college football poll released in January 2017 are listed. 1. Clemson 2. Alabama 3. USC 4. Washington
> The chances of winning are often written in terms of odds rather than probabilities. The odds of winning is the ratio of the number of successful outcomes to the number of unsuccessful outcomes. The odds of losing is the ratio of the number of unsuccessf
> The chances of winning are often written in terms of odds rather than probabilities. The odds of winning is the ratio of the number of successful outcomes to the number of unsuccessful outcomes. The odds of losing is the ratio of the number of unsuccessf
> The chances of winning are often written in terms of odds rather than probabilities. The odds of winning is the ratio of the number of successful outcomes to the number of unsuccessful outcomes. The odds of losing is the ratio of the number of unsuccessf
> The chances of winning are often written in terms of odds rather than probabilities. The odds of winning is the ratio of the number of successful outcomes to the number of unsuccessful outcomes. The odds of losing is the ratio of the number of unsuccessf
> Organize the data using the indicated type of graph. Describe any patterns. Use a time series chart to display the data shown in the table. The data represent the percentages of the U.S. gross domestic product (GDP) that come from the construction sector
> The chances of winning are often written in terms of odds rather than probabilities. The odds of winning is the ratio of the number of successful outcomes to the number of unsuccessful outcomes. The odds of losing is the ratio of the number of unsuccessf
> The chances of winning are often written in terms of odds rather than probabilities. The odds of winning is the ratio of the number of successful outcomes to the number of unsuccessful outcomes. The odds of losing is the ratio of the number of unsuccessf
> Write a statement that represents the complement of the probability. The probability of randomly choosing a smoker whose mother also smoked (Assume that you are choosing from the population of all smokers.)
> Write a statement that represents the complement of the probability. The probability of randomly choosing a tea drinker who has a college degree (Assume that you are choosing from the population of all tea drinkers.)
> A stem-and-leaf plot for the numbers of touchdowns allowed by all 128 NCAA Division I Football Bowl Subdivision teams in the 2016–2017 season is shown. Find the probability that a team chosen at random allowed a. at least 5
> Use the pie chart at the left, which shows the number of workers (in thousands) by industry for the United States. Find the probability that a worker chosen at random is not employed in the agriculture, forestry, fishing, and hunting industry. Worke
> Use the pie chart at the left, which shows the number of workers (in thousands) by industry for the United States. Find the probability that a worker chosen at random is employed in the manufacturing industry. Workers (in thousands) by Industry for
> Use the pie chart at the left, which shows the number of workers (in thousands) by industry for the United States. Find the probability that a worker chosen at random is not employed in the services industry. Workers (in thousands) by Industry for t
> Use the pie chart at the left, which shows the number of workers (in thousands) by industry for the United States. Find the probability that a worker chosen at random is employed in the services industry. Workers (in thousands) by Industry for the U
> Organize the data using the indicated type of graph. Describe any patterns. Use a time series chart to display the data shown in the table. The data represent the numbers of bachelor’s degrees in engineering (in thousands) conferred in
> There are six basic types of coloring in registered collies: sable (SSmm), tricolor (ssmm), trifactored sable (Ssmm), blue merle (ssMm), sable merle (SSMm), and trifactored sable merle (SsMm). The Punnett square below shows the possible coloring of the o
> A Punnett square is a diagram that shows all possible gene combinations in a cross of parents whose genes are known. When two pink snapdragon flowers (RW) are crossed, there are four equally likely possible outcomes for the genetic makeup of the offsprin
> Can any of the events in Exercises 75–78 be considered unusual? Explain.
> Based on previous counts, the probability of a salmon successfully passing through a dam on the Columbia River is 0.85. Is this statement an example of classical probability, empirical probability, or subjective probability?
> Find the probability that the next user surveyed is 36 to 49 years old. Ages Frequency, / 18 to 22 156 23 to 35 312 36 to 49 254 50 to 64 195 65 and over 58 Ef = 975
> In Example 6, determine the probability that the next adult surveyed read only digital books during the last year.
> Find the probability that a randomly selected draft pick is not a linebacker or a quarterback.
> 1. Find the probability that a donor selected at random has type B or type AB blood. 2. Find the probability that a donor selected at random does not have type O or type A blood. 3. Find the probability that a donor selected at random has type O blood
> Find the probability that the sales representative will sell between $0 and $49,999.
> 1. A die is rolled. Find the probability of rolling a 6 or an odd number. 2. A card is selected from a standard deck of 52 playing cards. Find the probability that the card is a face card or a heart.
> Organize the data using the indicated type of graph. Describe any patterns. Use a scatter plot to display the data shown in the table at the left. The data represent the numbers of students per teacher and the average teacher salaries (in thousands of do
> Use the frequency histogram to a. determine the number of classes. b. estimate the greatest and least frequencies. c. determine the class width. d. describe any patterns with the data. Roller Coaster Heights 40 35 30- 25 20 15 10 Height (in feet)
> Determine whether the events are mutually exclusive. Explain your reasoning. 1. Event A: Randomly select a jack from a standard deck of 52 playing cards. Event B: Randomly select a face card from a standard deck of 52 playing cards. 2. Event A: Random
> In a jury selection pool, 65% of the people are female. Of these 65%, one out of four works in a health field. 1. Find the probability that a randomly selected person from the jury pool is female and works in a health field. Is this event unusual? 2. F
> The probability that a particular rotator cuff surgery is successful is 0.9. 1. Find the probability that three rotator cuff surgeries are successful. 2. Find the probability that none of the three rotator cuff surgeries are successful. 3. Find the pr
> 1. The probability that a salmon swims successfully through a dam is 0.85. Find the probability that two salmon swim successfully through the dam. 2. Two cards are selected from a standard deck of 52 playing cards without replacement. Find the probabili
> Determine whether the events are independent or dependent. 1. Smoking a pack of cigarettes per day (A) and developing emphysema, a chronic lung disease (B) 2. Tossing a coin and getting a head (A), and then tossing the coin again and getting a tail (B)
> Refer to the survey in the second part of Example 1. Find the probability that a user is female, given that the user was not offended by something on social media. From Example 1: The table at the left shows the results of a survey in which 2276 social
> You select a card from a standard deck of playing cards. Find the probability of each event. 1. Event D: Selecting the nine of clubs 2. Event E: Selecting a heart 3. Event F: Selecting a diamond, heart, club, or spade
> How many license plates can you make when a license plate consists of 1. six (out of 26) alphabetical letters, each of which can be repeated? 2. six (out of 26) alphabetical letters, each of which cannot be repeated? 3. six (out of 26) alphabetical le
> You add another manufacturer, Toyota, and another color, tan, to the choices in Example 3. How many different ways can you select one manufacturer, one car size, and one color? Use a tree diagram to check your result.
> You ask for a student’s age at his or her last birthday. Determine the number of outcomes in each event. Then decide whether each event is simple or not. Explain your reasoning. 1. Event C: The student’s age is between 18 and 23, inclusive. 2. Event D:
> In terms of displaying data, how is a stem-and-leaf plot similar to a dot plot?
> For each probability experiment, determine the number of outcomes and identify the sample space. 1. A probability experiment consists of recording a response to the survey statement at the left and the gender of the respondent. 2. A probability experim
> In the frequency distribution in Example 9, 599.5 was chosen as the midpoint for the class of $500 or more. How does the sample mean and standard deviation change when the midpoint of this class is 650?
> Use the information in Example 8 to compare the z-scores for a 5-foot-tall man and a 5-foot-tall woman.
> The monthly utility bills in a city have a mean of $70 and a standard deviation of $8. Find the z-scores that correspond to utility bills of $60, $71, and $92. Assume the distribution of the utility bills is approximately bell-shaped.
> For the data set in Try It Yourself 2, find the percentile that corresponds to $26,000, which is the data entry 26.
> The points scored by the 51 winning teams in the Super Bowl (see page 39) are represented in the ogive at the left. What score represents the 10th percentile? How should you interpret this?
> Draw a box-and-whisker plot that represents the points scored by the 51 winning teams listed on page 39. What do you observe?
> Find the interquartile range for the points scored by the 51 winning teams listed on page 39. Are there any outliers?
> The tuition costs (in thousands of dollars) for 25 universities are listed. Use technology to find the first, second, and third quartiles. What do you observe? 44 30 38 23 20 29 19 44 29 17 45 39 29 18 43 45 39 24 44 26 34 20 35 30 36
> The Pennsylvania Game Commission conducted a study to count the number of elk in Pennsylvania. The commission captured and released 636 elk, which included 350 adult cows, 125 calves, 110 branched bulls, and 51 spikes. Is this study an observational stud
> Organize the data using the indicated type of graph. Describe any patterns. Use a scatter plot to display the data shown in the table at the left. The data represent the numbers of hours worked and the hourly wages (in dollars) of 12 production workers.
> Find the coefficient of variation for the office rental rates in Los Angeles (see Example 4) and for those in Dallas (see Try It Yourself 4). Then compare the results.
> Find the first, second, and third quartiles for the points scored by the 51Â winning teams using the data set listed on page 39. What do you observe? Class Frequency,S 14-19 5 20-25 12 26-31 13 32-37 11 38-43 5 44-49 3 50-55 2
> Change three of the 6’s in the data set to 4’s. How does this change affect the sample mean and sample standard deviation?
> Apply Chebychev’s Theorem to the data for Iowa using k = 2. What can you conclude? Is an age of 80 unusual for an Iowa resident? Explain.
> Estimate the percent of women ages 20 –29 whose heights are between 64.2 inches and 67.1 inches. Heights of Women in the U.S. Ages 20-29 34.13% 13.59% 555 84 613 642 621 20.0 729 1-2 I+2 Height (in inches)
> Write a data set that has 10 entries, a mean of 10, and a population standard deviation that is approximately 3. (There are many correct answers.)
> Sample office rental rates (in dollars per square foot per year) for Dallas are listed. Use technology to find the mean rental rate and the sample standard deviation. 18 27 21 14 20 20 24 11 16 7 12 22 10 15 21 34 23 13 38 16 18 30 15 30
> Refer to the study in Example 3. The recovery times (in days) for Group 2 are listed below. Find the sample variance and standard deviation of the recovery times. 43 57 18 45 47 33 49 24
> Find the population variance and standard deviation of the starting salaries for Corporation B in Example 1.
> Find the range of the starting salaries for Corporation B. Compare the result to the one in Example 1.
> Organize the data using the indicated type of graph. Describe any patterns. The average owning and operating costs for four types of vehicles in the United States in 2016 include small sedans ($6579), medium sedans ($8604), SUVs ($10,255), and minivans (

