Question: Annual growth rates for individual firms in
Annual growth rates for individual firms in the toy industry tend to fluctuate dramatically, depending on consumers’ tastes and current fads. Consider the following growth rates (in %) for two firms in this industry, Hasbro and Mattel.
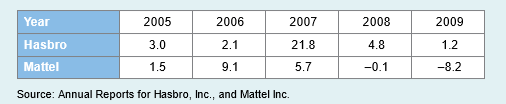
a. Calculate the geometric mean growth rate for each firm.
b. Use the standard deviation to evaluate the variability for each firm.
c. Which firm had the higher geometric mean growth rate? Which firm’s growth rate had greater variability?
Transcribed Image Text:
Year 2005 2006 2007 2008 2009 Hasbro 3.0 2.1 21.8 4.8 1.2 Mattel 1.5 9.1 5.7 -0.1 -8.2 Source: Annual Reports for Hasbro, Inc., and Mattel Inc.
> Suppose the 90% confidence interval for the mean SAT scores of applicants at a business college is given by [1690, 1810]. This confidence interval uses the sample mean and the sample standard deviation based on 25 observations. What are the sample mean a
> The historical returns on a balanced portfolio have had an average return of 8% and a standard deviation of 12%. Assume that returns on this portfolio follow a normal distribution. a. What percentage of returns were greater than 20%? b. What percentage o
> Let X be normally distributed with mean μ = 10 and standard deviation σ = 4. a. Find P (X ≤ 0). b. Find P (X > 2). c. Find P (4 ≤ X ≤ 10). d. Find P (6 ≤ X ≤ 14).
> A price-earnings ratio, or P/E ratio, is calculated as a firm’s share price compared to the income or profit earned by the firm per share. Generally, a high P/E ratio suggests that investors are expecting higher earnings growth in the future compared to
> As reported by tradingeconomics.com on September 2, 2012, the unemployment rates (in %) in major economies around the world were as follows: Country ……………………………………………………………………... Unemployment Rate Australia ……………………………………………………………………....................
> Let X be normally distributed with mean μ = 10 and standard deviation σ = 6. a. Find P (X ≤ 0). b. Find P (X > 2). c. Find P (4 ≤ X ≤ 10). d. Find P (6 ≤ X ≤ 14).
> The effort to reward city students for passing Advanced Placement tests is part of a growing trend nationally and internationally. Financial incentives are offered in order to lift attendance and achievement rates. One such program in Dallas, Texas, offe
> Let X be normally distributed with mean μ = 2.5 and standard deviation σ = 2. a. Find P (X > 7.6). b. Find P (7.4 ≤ X ≤ 10.6). c. Find x such that P (X > x) = 0.025. d. Find x such that P (x ≤ X ≤ 2.5) = 0.4943.
> The Chartered Financial Analyst (CFA) designation is fast becoming a requirement for serious investment professionals. Although it requires a successful completion of three levels of grueling exams, it also entails promising careers with lucrative salari
> Let X be normally distributed with mean μ = 120 and standard deviation σ = 20. a. Find P (X ≤ 86). b. Find P (80 ≤ X ≤ 100). c. Find x such that P (X ≤ x) = 0.40. d. Find x such that P (X > x) = 0.90.
> Mark Underwood is a professor of economics at Indiana University. He has been teaching Principles of Economics for over 25 years. Professor Underwood uses the following scale for grading. Grade ………………………………………………………………………………… Probability A …………………………………
> Organizers of an outdoor summer concert in Toronto are concerned about the weather conditions on the day of the concert. They will make a profit of $25,000 on a clear day and $10,000 on a cloudy day. They will take a loss of $5,000 if it rains. The weath
> A random sample of eight drugstores shows the following prices (in $) of a popular pain reliever: Assume the normal distribution for the underlying population to construct the 90% confidence interval for the population mean. 3.50 4.00 2.00 3.00 2.5
> Let the following sample of 8 observations be drawn from a normal population with unknown mean and standard deviation: 22, 18, 14, 25, 17, 28, 15, 21. a. Calculate the sample mean and the sample standard deviation. b. Construct the 80% confidence interva
> An analyst has developed the following probability distribution for the rate of return for a common stock. a. Calculate the expected rate of return. b. Calculate the variance and the standard deviation of this probability distribution. Scenario Pro
> You were informed at the nursery that your peach tree will definitely bloom sometime between March 18 and March 30. Assume that the bloom times follow a continuous uniform distribution between these specified dates. a. What is the probability that the tr
> The Netherlands is one of the world leaders in the production and sale of tulips. Suppose the heights of the tulips in the greenhouse of Rotterdam’s Fantastic Flora follow a continuous uniform distribution with a lower bound of 7 inches and an upper boun
> For decades, people have believed that boys are innately more capable than girls in math. In other words, due to the intrinsic differences in brains, boys are better suited for doing math than girls. Recent research challenges this stereotype, arguing th
> Find tα, df from the following information. a. α = 0.025 and df = 12 b. α = 0.10 and df = 12 c. α = 0.025 and df = 25 d. α = 0.10 and df = 25
> A safety officer is concerned about speeds on a certain section of the New Jersey Turnpike. He records the speeds of 40 cars on a Saturday afternoon. The accompanying table shows a portion of the results. Assume that the population standard deviation is
> An economist wants to estimate the mean hourly wage (in $) of all workers. She collects data on 50 hourly wage earners. A portion of the data is shown in the accompanying table. Assume that the population standard deviation is $6. Construct and interpret
> After Donald Trump won the election, the consumer confidence index rose to 93.8, a six month high (www.bloomberg.com, November 23, 2016). Given new economic data, an analyst believes that there is a 75% chance that the index will fall below 90 and only a
> A manager is interested in estimating the mean time (in minutes) required to complete a job. His assistant uses a sample of 100 observations to report the confidence interval as [14.355, 17.645]. The population standard deviation is known to be equal to
> Suppose the 95% confidence interval for the mean salary of college graduates in a town in Mississippi is given by [$36,080, $43,920]. The population standard deviation used for the analysis is known to be $12,000. a. What is the point estimate of the me
> U.S. consumers are increasingly viewing debit cards as a convenient substitute for cash and checks. The average amount spent annually on a debit card is $7,790 (Kiplinger’s, August 2007). Assume that this average was based on a sample of 100 consumers an
> A family is relocating from St. Louis, Missouri, to California. Due to an increasing inventory of houses in St. Louis, it is taking longer than before to sell a house. The wife is concerned and wants to know when it is optimal to put their house on the m
> A random variable X follows the continuous uniform distribution with a lower limit of 750 and an upper limit of 800. a. Calculate the mean and the standard deviation for the distribution. b. What is the probability that X is less than 770?
> A random variable X follows the continuous uniform distribution with a lower limit of 10 and an upper limit of 30. a. Calculate the mean and the standard deviation for the distribution. b. What is the probability that X is greater than 22? c. What is the
> Harvard University revolutionized its financial aid policies, aimed at easing the financial strain on middle and upper-middle income families (Newsweek, August 18–25, 2008). The expected contribution of students who are admitted to Harv
> The average life expectancy for Bostonians is 78.1 years (The Boston Globe, August 16, 2010). Assume that this average was based on a sample of 50 Bostonians and that the population standard deviation is 4.5 years. a. What is the point estimate of the po
> Identify the possible values of the following random variables. Which of the random variables are discrete? a. The numerical grade a student receives in a course. b. The grade point average of a student. c. The salary of an employee, defined in figures (
> Consider the following cumulative probability distribution. a. Calculate P (X ≤ 0). b. Calculate P (X = 50). c. Is this a discrete uniform distribution? Explain. X -25 25 50 P (X <x) 0.25 0.50 0.75 1
> An accounting professor wants to know the average GPA of the students enrolled in her class. She looks up information on Blackboard about the students enrolled in her class and computes the average GPA as 3.29. a. Describe the relevant population. b. Do
> Find Zα⁄2 for each of the following confidence levels used in estimating the population mean. a. 89% b. 92% c. 96%
> Find Zα⁄2 for each of the following confidence levels used in estimating the population mean. a. 90% b. 98% c. 88%
> Customers at Costco spend an average of $130 per trip (The Wall Street Journal, October 6, 2010). One of Costco’s rivals would like to determine whether its customers spend more per trip. A survey of the receipts of 25 customers found that the sample mea
> Consider the following hypothesis test: A random sample of 36 observations yields a sample mean of −125. The population standard deviation is 42. Conduct the test at α = 0.01. H μ=-100 H: μ+-100 –100
> Consider the following hypothesis test: A random sample of 100 observations yields a sample mean of 80. The population standard deviation is 30. Calculate the p-value. What is the conclusion to the test if α = 0.10? μ< 75 μ> 75 Hoi fe
> Consider the following hypothesis test: A random sample of 50 observations yields a sample mean of −3. The population standard deviation is 10. Calculate the p-value. What is the conclusion to the test if α = 0.05? H
> A researcher wants to determine if the population mean is greater than 45. A random sample of 36 observations yields a sample mean of 47. Assume that the population standard deviation is 8. a. Specify the competing hypotheses to test the researcher’s cla
> Consider the following hypotheses: a. A sample of 80 observations results in a sample mean of 144. The population standard deviation is known to be 28. b. Calculate the value of the test statistic and the p-value. c. Does the above sample evidence enab
> Consider the following hypotheses: A sample of 16 observations yields a sample mean of 95. Assume that the sample is drawn from a normal population with a population standard deviation of 10. a. Calculate the value of the test statistic. b. Find the p-
> American football is the highest paying sport on a pergame basis. Given that the quarterback is considered the most important player on an NFL team, he is typically well-compensated. Consider a portion of the following quarterback salary data (in $ milli
> Forty families gathered for a fund-raising event. Suppose the individual contribution for each family is normally distributed with a mean and a standard deviation of $115 and $35, respectively. The organizers would call this event a success if the total
> The typical college student graduates with $27,200 in debt (The Boston Globe, May 27, 2012). Let debt among recent college graduates be normally distributed with a standard deviation of $7,000. a. What is the probability that the average debt of four rec
> The following table shows the annual returns (in %) for two of Putnam’s mutual funds: the Voyager Growth Fund and the George Putnam Balanced Fund. a. Calculate and interpret the covariance. b. Calculate and interpret the correlation
> A manager of a local retail store analyzes the relationship between advertising (in $100s) and sales (in $1,000s) by reviewing the store’s data for the previous six months. Advertising ………………………………………………………………………………………… Sales 20 ………………………………………………………………
> The National Sporting Goods Association (NSGA) conducted a survey of the ages of individuals that purchased skateboarding footwear. The ages of this survey are summarized in the following percent frequency distribution. Age of User ………………………………………………………
> In order to lure female customers, a new clothing store offers free gourmet coffee and pastry to its customers. The average daily revenue over the past five-week period has been $1,080 with a standard deviation of $260. Use this sample information to con
> The following table shows the revenues (in $ millions) for The Gap and American Eagle Outfitters for the years 2008–2010. Source: Annual Reports for Gap, Inc., and American Eagle Outfitters, Inc. a. Calculate the average growth rate
> The weight of turkeys is known to be normally distributed with a mean of 22 pounds and a standard deviation of 5 pounds. a. Discuss the sampling distribution of the sample mean based on a random draw of 16 turkeys. b. Find the probability that the mean w
> The manager at a water park constructed the following frequency distribution to summarize attendance for 60 days in July and August. Attendance ………………………………………………………………………………………… Frequency 1,000 up to 1,250 ………………………………………………………………………………………………. 5 1,250
> In a CBS News survey, 829 respondents were provided with a list of major events and asked which event would happen first. The events and their responses are summarized in the following percent frequency table. Cure for cancer found ………………………………………………………
> Despite its nutritional value, seafood is only a tiny part of the American diet, with the average American eating just 16 pounds of seafood per year. Janice and Nina both work in the seafood industry and they decide to create their own random samples and
> The following table lists the sales (in $ millions) of the top Italian restaurant chains in 2009. Restaurant ……………………………………………………………………………………………. Sales Olive Garden ………………………………………………………………………………………… 3,300 Carrabba’s Italian Grill …………………………………………………………
> Beer bottles are filled so that they contain an average of 330 ml of beer in each bottle. Suppose that the amount of beer in a bottle is normally distributed with a standard deviation of 4 ml. a. What is the probability that a randomly selected bottle wi
> According to a survey, high school girls average 100 text messages daily (The Boston Globe, April 21, 2010). Assume the population standard deviation is 20 text messages. Suppose a random sample of 50 high school girls is taken. a. What is the probabilit
> You score 90 on the midterm, 60 on the final, and 80 on the class project. What is your average score if the midterm is worth 30%, the final is worth 50%, and the class project is worth 20%?
> The following table presents a portion of the annual returns for two mutual funds offered by the investment giant Fidelity. The Fidelity Select Automotive Fund invests primarily in companies engaged in the manufacturing, marketing, or sales of automobile
> A social scientist wants to analyze the relationship between educational attainment and salary. He interviews eight people. The accompanying table shows each person’s years of higher education (Education in years) and corresponding sala
> The following table shows the annual returns (in %) for T. Rowe Price’s Value and International Stock funds for the time period 2005–2009. a. Calculate and interpret the covariance between the returns. b. Calculate a
> A random sample of size n = 50 is taken from a population with mean μ = −9.5 and standard deviation σ = 2. a. Calculate the expected value and the standard error for the sampling distribution of the sample mean. b. What is the probability that the sample
> A random sample of size n = 100 is taken from a population with mean μ = 80 and standard deviation σ = 14. a. Calculate the expected value and the standard error for the sampling distribution of the sample mean. b. What is the probability that the sample
> Acceptance sampling is an important quality control technique, where a batch of data is tested to determine if the proportion of units having a particular attribute exceeds a given percentage. Suppose that 10% of produced items are known to be nonconform
> The producer of a particular brand of soup claims that its sodium content is 50% less than that of its competitor. The food label states that the sodium content measures 410 milligrams per serving. Assume the population of sodium content is normally dist
> According to a report, scientists in New England say they have identified a set of genetic variants that predicts extreme longevity with 77% accuracy (The New York Times, July 1, 2010). Assume 150 patients decide to get their genomes sequenced. a. If th
> A random sample is drawn from a normally distributed population with mean μ = 12 and standard deviation σ = 1.5. a. Comment on the sampling distribution of the sample mean with n = 20 and n = 40. b. Can you use the standard normal distribution to calcula
> Data from the Bureau of Labor Statistics’ Consumer Expenditure Survey show that annual expenditures for cellular phone services per consumer unit increased from $210 in 2001 to $608 in 2007. Let the standard deviation of annual cellular expenditure be $4
> Georgia residents spent an average of $470.73 on the lottery in 2010, or 1% of their personal income (www.msn.com, May 23, 2012). Suppose the amount spent on the lottery follows a normal distribution with a standard deviation of $50. a. What is the proba
> Texas is home to more than one million undocumented immigrants, and most of them are stuck in low-paying jobs. Meanwhile, the state also suffers from a lack of skilled workers. The Texas Workforce Commission estimates that 133,000 jobs are currently unfi
> Trader Joe’s is a privately held chain of specialty grocery stores in the United States. Starting out as a small chain of convenience stores, it has expanded to over 340 stores as of June 2010 (www.traderjoes.com). It has developed a reputation as a uniq
> An automatic machine in a manufacturing process is operating properly if the length of an important subcomponent is normally distributed with a mean μ = 80 cm and a standard deviation σ = 2 cm. a. Find the probability that the length of one randomly sele
> While starting salaries have fallen for college graduates in many of the top hiring fields, there is some good news for business undergraduates with concentrations in accounting and finance (Bloomberg Businessweek, July 1, 2010). According to the Nationa
> Presidential job approval is the most-watched statistic in American politics. According to the June 2010 NBC/Wall Street Journal public opinion poll, President Barack Obama had reached his lowest approval rating since taking office in January of 2009. Th
> According to the Bureau of Labor Statistics, it takes an average of 22 weeks for someone over 55 to find a new job, compared with 16 weeks for younger workers (The Wall Street Journal, September 2, 2008). Assume that the probability distributions are nor
> The college admissions office at a local university usually admits 750 students and knows from previous experience that 25% of these students choose not to enroll at the university. a. Construct the centerline and the upper and lower control limits for
> A firm produces computer chips for personal computers. From past experience, the firm knows that 4% of the chips are defective. The firm collects a sample of the first 500 chips manufactured at 1:00 pm for the past two weeks. The following sample proport
> A manufacturing process produces steel rods in batches of 1,000. The firm believes that the percent of defective items generated by this process is 5%. a. Construct the centerline and the upper and lower control limits for the chart. b. An engineer inspe
> Fast bowling, also known as pace bowling, is an important component of the bowling attack in the sport of cricket. The objective is to bowl at a high speed and make the ball turn in the air and off the ground so that it becomes difficult for the batsman
> A production process is designed to fill boxes with an average of 14 ounces of cereal. The population of filling weights is normally distributed with a standard deviation of 2 ounces. Inspectors take periodic samples of 10 boxes. The following sample mea
> The monthly closing stock prices (rounded to the nearest dollar) for Panera Bread Co. for the first six months of 2010 are reported in the following table. Month …………………………………………………………………………… Closing Stock Price January ………………………………………………………………………………………
> Major League Baseball Rule 1.09 states that “the baseball shall weigh not less than 5 or more than 5¼ ounces” (www.mlb.com). Use these values as the lower and the upper control limits, respectively. Assum
> Random samples of size n = 400 are taken from a population with p = 0.10. a. Construct the centerline and the upper and lower control limits for the chart. b. Suppose six samples of size 400 produced the following sample proportions: 0.06, 0.11, 0.09, 0.
> Random samples of size n = 500 are taken from a population with p = 0.34. a. Construct the centerline and the upper and lower control limits for the chart. b. Suppose six samples of size 500 produced the following sample proportions: 0.28, 0.30, 0.33, 0.
> The issues surrounding the levels and structure of executive compensation have gained added prominence in the wake of the financial crisis that erupted in the fall of 2008. Based on the 2006 compensation data obtained from the Securities and Exchange Com
> A study finds that companies are setting aside a large chunk of their IT spending for green technology projects (BusinessWeek, March 5, 2009). Two out of three of the large companies surveyed by Deloitte said they have at least 5% of their IT budget earm
> A random sample of size n = 80 is taken from a population of size N = 600 with a population proportion p = 0.46. a. Is it necessary to apply the finite population correction factor? Explain. Calculate the expected value and the standard error of the samp
> A random sample of size n = 100 is taken from a population of size N = 3,000 with a population proportion of p = 0.34. a. Is it necessary to apply the finite population correction factor? Explain. Calculate the expected value and the standard error of th
> A random sample of size n = 70 is taken from a finite population of size N = 500 with mean μ = 220 and variance σ2 = 324. a. Is it necessary to apply the finite population correction factor? Explain. Calculate the expected value and the standard error of
> A random sample of size n = 100 is taken from a population of size N = 2,500 with mean μ = −45 and variance σ2 = 81. a. Is it necessary to apply the finite population correction factor? Explain. Calculate the expected value and the standard error of the
> According to a FCC survey, one in six cell phone users has experienced “bill shock” from unexpectedly high cell phone bills (Tech Daily Dose, May 26, 2010). a. Discuss the sampling distribution of the sample proportion based on a sample of 200 cell phone
> The following table shows the annual returns (in percent) for Fidelity’s Electronics and Utilities funds. a. Derive the 99% confidence intervals for the mean returns for Fidelity’s Electronics and Utilities funds. b.
> Discuss the consequences of Type I and Type II errors for each of the claims considered in the preceding question.
> Define the consequences of Type I and Type II errors for each of the tests considered in the preceding question.
> Which of the following statements are correct? Explain if incorrect. a. “I accept the null hypothesis since sample evidence is not inconsistent with the null hypothesis.” b. “Since sample evidence cannot be supported by the null hypothesis, I reject the
> Explain why the following statements are not correct. a. “With my methodological approach, I can reduce the Type I error with the given sample information without changing the Type II error.” b. “I have already decided how much of the Type I error I am g
> Residents of Hawaii have the longest life expectancies in the United States, averaging 81.48 years (www.worldlifeexpectancy.com; data retrieved June 4, 2012). A sociologist collects data on the age at death for 50 recently deceased Michigan residents. a.
> A report suggests that business majors spend the least amount of time on course work than do all other college students (The New York Times, November 17, 2011). A provost of a university conducts a survey of 50 business and 50 nonbusiness students. Stude
> The euro-zone crisis has wreaked havoc on U.S. stock markets (The Wall Street Journal, June 8, 2012). A portfolio analyst wonders if the average trading volume on the Dow Jones Industrial Average (DJIA) has decreased since the beginning of the year. She
> The Great Recession cost America trillions of dollars in lost wealth and also levied a heavy toll on the national psyche (The Wall Street Journal, December 21, 2009). According to a poll, just 33% of those surveyed said America was headed in the right di

