Question: For the extracurricular data of Exercise 2.
For the extracurricular data of Exercise 2.3, calculate the interquartile range.
Data from Exercise 2.3:
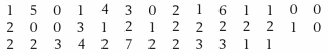
A student at the University of Wisconsin surveyed 40 students in her dorm concerning their participation in extracurricular activities during the past week. The data on number of activities are
> Examine if the following are legitimate probability distributions.
> A study by the National Endowment of the Arts revealed that 19.7% of adults age 18-24 played a musical instrument in the past 12 months. Suppose that is still the current rate. What is the normal approximation to the probability, that in a random sample
> Let the number of successes X have a binomial distribution with n = 20 and p = .5 (a) Find the exact probability of each of the following (b) Apply the normal approximation to each situation in part (a).
> Let the number of successes X have a binomial distribution with n = 25 and p = .6 (a) Find the exact probabilities of each of the following: (b) Apply the normal approximation to each situation in part (a).
> It is reasonable to model the distribution that produced the lizards' speed test as normal distribution with mean 1.7 mis and standard deviation .57 m is. Find the probability that the speed of a new lizard (a) Will exceed 2.5 m is. (b) Will be less th
> The time for an emergency medical squad to arrive at the sports center at the edge of town is distributed as a normal variable with µ = 17 minutes and ( = 3 minutes. (a) Determine the probability that the time to arrive is: (i) More than 22 minutes. (
> Suppose the contents of bottles of water coming off a production line have a normal distribution with mean 9.1 ounces and standard deviation .1 ounce. (a) If every bottle is labeled 9 ounces, what proportion of the bottles contain less than the labeled a
> Refer to Exercise 6. IO where, according to current U.S. Census Bureau data, the heights of 20- to 29-year-old women can be well approximated by a normal distribution with mean 64.1 inches and standard deviation 3.1 inches. (a) What is the probability t
> Th e diameter of hail hitting the ground during a storm is normally distributed with a mean of .5 inch and a standard deviation of .1 inch . What is the probability that: (a) A hailstone picked up at random will have a diameter greater than . 71 inch ?
> The weights of apples served at a restaurant are normally distributed with a mean of 5 ounces and standard deviation of 1.2 ounces. What is the probability that the next person served will be given an apple that weighs less than 4 ounces?
> Th e time it takes a symphony orchestra to play Beethoven's Ninth Symphony has a normal distribution with a mean of 64.3 minutes and a standard deviation of 1.15 minutes. The next time it is played, what is the probability that it will take between 62.5
> Let the random variable X represent the sum of the points in two tosses of a die. (a) List the possible values of X. (b) For each value of X, list the corresponding elementary outcomes. (c) Obtain the probability distribution of X .
> For the curve f(x) graphed in Exercise 6.1(c), which of the two intervals [ 0 < X < .5] or [ 1.5 < X < 2] is assigned a higher probability?
> According to the children's growth chart that doctors use as a reference, the heights of two-year old boys are nearly normally distributed with a mean of 34.5 inches and a standard deviation of 1.4 inches. If a two-year-old boy is selected at random, wha
> It is reasonable to model the distribution that produced the College Qualification Test (CQT) data as a normal distribution with mean 150 and standard deviation 25.4. (a) What is the probability of a new student scoring above 195? (b) What score has prob
> Scores on a certain nationwide college entrance examination follow a normal distribution with a mean of 500 and a standard deviation of 100. Find the probability that a student will score: (a) Over 650. (b) Less than 250. (c) Between 325 and 675.
> Referring to Exercise 6.25, find b such that (a) P[ X < b] = .7995 (b) P [ X > b ] = .002 (c) P[X < b ] = .015 Data from Exercise 6.25: Data suggests that the normal distribution with mean 13.0 and standard deviation 2.4 is a plausible model for the
> Data suggests that the normal distribution with mean 13.0 and standard deviation 2.4 is a plausible model for the length (feet) of adult anaconda snakes. Find (a) P[X < 10.4 ] (b) P [ X ≤ 17.8 ] (c) P [ X > 17.8 ] (d) P[X > 16. 72 ] (e) P [10.24 ≤ X ≤ 1
> Find (a) P(Z. < .14) (b) The 14th percentile of Z. (c) P(Z < .86) (d) The 86th percentile of Z.
> Find (a) P [Z < .33 ]. (b) The 33rd percentile of the standard normal distribution. (c) P [Z < .97 ]. (d) The 97th percentile of the standard normal distribution.
> Find the quartiles of the standard normal distribution.
> Find the z value in each of the following cases . (a) P[Z < z ] = .1762 (b) P[Z > z ] = .10 (c) P[-z < Z < z ] = .954 (d) P[-.6 < Z < z ] = .50
> Refer to Exercise 5.9 but let X denote the maximum years’ experience among the two persons selected. (a) List all choices and the corresponding values of X. (b) List the distinct values of X . (c) Obtain the probability distribution of X. Data from E
> Identify each of the following as a discrete or continuous random variable. (a) Number of empty seats on a flight from Atlanta to London. (b) Yearly low temperature in your city. (c) The height of the highest wave on the north shore of Hawaii next winter
> On flights from San Francisco to Chicago, the number of empty seats are to be grouped into the following classes: 0-4, 5- 9, 10- 14, 15- 19, more than 19. Is it possible to determine from this frequency distribution the exact number of flights on which t
> The weights of the players on the university football team (to the nearest pound) are to be grouped into the following classes: 160-175, 175-190, 190-205, 205-220, 220-235, 235 or more. The left endpoint is included but not the right endpoint. Explain wh
> Cities must find better ways to dispose of solid waste. According to the Environmental Protection Agency, in a recent year, the composition of solid municipal waste was (a) Determine the percentage of other materials in the solid waste. This category inc
> Make a control chart for the extraordinary event overtime data in Example 23 after removing the outlier identified in that example. You need to recalculate the mean and standard deviation.
> Make a control chart for the data in Exercise 2.93 and comment. Data from Exercise 2.93: A city department has introduced a quality improvement program and has allowed employees to get credit for overtime hours when attending meetings of their quality g
> Make a control chart for the data referred to in Exercise 2.92 and comment. Data from Exercise 2.92: Make a time plot of the mail order phone call data in Exercise 2.48 and comment on the statistical control. Data from Exercise 2.48: A large mail-order
> A city department has introduced a quality improvement program and has allowed employees to get credit for overtime hours when attending meetings of their quality groups. The total number of overtime meeting hours for each of the 26 pay periods in one ye
> Make a time plot of the mail order phone call data in Exercise 2.48 and comment on the statistical control. Data from Exercise 2.48: A large mail-order firm employs numerous persons to take phone orders. Computers on which orders are entered also automa
> With reference to Exercise 2.90: (a) Calculate the median number of lost House seats. (b) Find the maximum and minimum losses and identify these with a president. (c) Det ermine the range for the number of House seats lost. Data from Exercise 2.90: P
> Presidents also take midterms1 After two years of the president's term, members of Congress are up for election. The following table gives the number of net seats lost, by the party of the president, in the House of Representatives starting from Eisenhow
> Which of the following are anecdotal and which are based on a sample? (a) Seventy-five text messages were sent one day during a lecture by students in a large class. (b) Erik says he gets the best bargains at online auctions by bidding on items whose ter
> Refer to Exercise 2.3 and the data on extracurricular activities. Find the sample mean and standard deviation. Data from Exercise 2.3: A student at the University of Wisconsin surveyed 40 students in her dorm concerning their participation in extracurri
> Refer to the data on hours of sleep. (a) Obtain the five-number summary: minimum, Q1, Q2 , Q3, and maximum. (b) Make a boxplot of the hours of sleep.
> Referring to the earthquake data in Exercise 2.20, (a) Find the sample mean and standard deviation. (b) What proportion of these observations lies between x ± 2 s? Data from Exercise 2.20: In a recent year, 35 sites around the world expe
> Referring to the earthquake data in Exercise 2.20, (a) Obtain a five-number summary: minimum, Q1, Q2, Q3, maximum. (b) Construct a boxplot. Data from Exercise 2.20: In a recent year, 35 sites around the world experienced earthquakes of magnitude great
> Refer to the data on throwing speed in Exercise 2.42. Make separate boxplots to compare males and females. Data from Exercise 2.42: Physical education researchers interested in the development of the overarm throw measured the horizontal velocity of a t
> Two cities provided the following information on public school teachers' salaries. (a) Construct a boxplot for the salaries in City A. (b) Construct a boxplot, on the same graph, for the salaries in City B. (c) Are there larger differences at the lower
> The weights ( oz) of nineteen babies born in Madison Wisconsin are summarized in the computer output. Obtain the z score for a baby weighing (a) 102 oz (b) 144 oz
> z-value of a measurement = Measurement - x¯ / s When two measurements originate from different sources, converting them to the z scale helps to draw a sensible interpretation of their relative magnitudes. For instance, suppose a student scored 65 in a ma
> Refer to the data on number of returns. (a) Calculate x and s. (b) Find the proportions of the observations that are in the intervals x ± s, x ± 2 s, and x ± 3 s. (c) Compare the results of part (b) with the empirical guidelines.
> Refer to the data on lizards in Exercise 2.19. (a) Calculate x ands. (b) Find the proportion of the observations that are in the intervals x ± s, x ± 2 s, and x ± 3 s. (c) Compare the results of part (b) with
> Which of the following are anecdotal and which are based on a sample? (a) Ellie told her friends that she is saving $31 a month because she changed to a prepaid cell phone. (b) One morning, among a large number of coffee shop patrons, the orders of 47 c
> Refer to the data on bone mineral content in Exercise 2.41. (a) Calculate x ands. (b) Find the proportion of the observations that are in the intervals x ± s, x ± 2 s, and x ± 3 s. (c) Compare the results of p
> Calculations with the test scores data of Exercise 2.22 give x = 150.125 and s = 24.677. (a) Find the proportion of the observations in the intervals x ± 2 s and x ± 3 s. (b) Compare your findings in part (a) with those su
> Should you be surprised if the range is larger than twice the interquartile range? Explain.
> For the data set of Exercise 2.22, calculate the interquartile range. Data from Exercise 2.22: The following data represent the scores of 40 students on a college qualification test (courtesy of R. W. Johnson).
> 1. If a fixed number c is added to all measurements in a data set, the deviations ( x - x¯) remain unchanged. Consequently, s2 and s remain unchanged. 2. If all measurements in a data set are multiplied by a fixed number d, the deviations ( x - x) get
> The weights (oz) of nineteen babies born in Madison, Wisconsin, are summarized in the computer output. (a) Locate a measure of variation and also calculate the sample variance. (b) Calculate the interquartile range and interpret this value. (c) Give a v
> The monthly number of hours students spend doing community service are summarized in the computer output: (a) Locate a measure of variation and also calculate the sample variance. (b) Calculate the interquartile range and interpret this value. (c) Give
> The performance time (minutes) for Beethoven's Ninth Symphony is obtained from each of seven compact discs. 66.9 66.2 71.0 68.6 65.4 68.4 71.9 (a) Find the sample median. (b) Find the sample mean . (c) Find the sample standard deviation. (d) Use soft
> With reference to checked bags in Exercise 2.13, (a) Find the sample mean . (b) Find the sample standard deviation. Data from Exercise 2.13: A sample of 50 departing airline passengers at the main check-in counter produced the following number of bags
> About 42% of the members of a local hiking club own a dog. Should these people be considered as a random sample of dog ownership for persons living in the city7
> With reference to the data on the length of 10 major league baseball games in Exercise 2.43: (a) Find the sample mean. (b) Find the sample variance. (c) Find the sample standard deviation. Data from Exercise 2.43: On opening day one season, 10 major
> With reference to the radiation leakage data given in Exercise 2.15, calculate : (a) The sample variance. (b) The sample standard deviation. Data from Exercise 2.15: Before microwave ovens are sold, the manufacturer must check to ensure that the radia
> Refer to Exercise 12.16. The estimated standard errors of β1 and β2 are .0606 and .0632, respectively. (a) Obtain a 90% confidence interval for β1. (b) Test H0 : β2 = .5 versus H1 : β1 ≠ .5 with .05. Data from Exercise 12.16: Some researchers illust
> Some researchers illustrate a multiple linear regression equation to predict the yearly output of an oil field. We use their latest 20 years of data and change the units of three of their variables to y = loge (yearly output) where output is measured in
> Consider the data on a response variable and two predictor variables. (a) Fit a multiple regression model with response variable y. (b) Verify your answer using software.
> A genetic experiment is undertaken to study the competition between two types of female flies (Drosophila melanogaster) in cages with one male genotype acting as a substrate. The independent variable x is the time spent in cages, and the dependent variab
> An environmental scientist identified a point source for E. Coli at the edge of a stream. She then measured y = E. Coli, in colony forming units per I 00 ml of water, at different distances, in feet, downstream from the point source. Suppose she obtains
> Let X1 , … , Xn, be a random sample from a continuous population whose median is denoted by M. For testing H0 : M = M0, we can use the sign test statistic S = No. of Xi > M0, i = 1, ... , n. H0 is rejected at level a in favor of H1
> Evaluate: (a) Sign test statistic. (b) Signed-rank statistic.
> (a) Calculate Spearman's rank correlation for the data on Chester Whites. (b) Test for independence of calcium and phosphate levels using the rejection region. (c) What is the approximate level of significance?
> A mixture of compounds called phenolics occurs in wood waste products. It has been found that when phenolics are present in large quantities, the waste becomes unsuitable for use as a livestock feed. To compare two species of wood, a dairy scientist meas
> The city of Madison regularly checks the quality of water at swimming beaches located on area lakes. Fifteen times the concentration of fecal coliforms, in number of colony forming units (CFU) per 100 ml of water, was measured during the summer at one be
> In a study of the cognitive capacities of nonhuman primates, 19 monkeys of the same age are randomly divided into two groups of 10 and 9. The groups are trained by two different teaching methods to recollect an acoustic stimulus. The monkeys' scores on a
> Referring to Exercise 15.27, calculate: (a) The sign test statistic. (b) The significance probability when the alternative is that Judge 2 gives higher scores than Judge I. Data from Exercise 15.27: Five finalists in a figure-skating contest are rated
> Using Appendix B, Table 9, find: (a) P[ T+ ≥ 28 ] when n = 8. (b) P [ r+ ≤ 5 ] when n = 7. (c) The point c such that P [ T+ ≤ c ] is approximately .05 when n = 13.
> Five finalists in a figure-skating contest are rated by two judges on a 10-point scale as follows: Calculate the Spearman's rank correlation rSp between the two ratings.
> Using Appendix B, Table 8, find: (a) P [ Ws ≥ 42] when n1 = 5, n2 = 7. (b) P [ Ws ≤ 25 ] when n1 = 6, n2 = 6. (c) P[Ws ≥ 81 or Ws ≤ 4S ] when n1 = 10, n2 = 7. (d) The point c such
> Three male and three female students recorded the number of times they used a credit card in one week. Designate males as population A. Evaluate WA.
> Refer to the output here concerning the time (min) it took four different persons (blocks) to complete three different tasks. (a) Identify the SSE and its degrees of freedom. (b) Are the block means different? Check the calculation of F for blocks from
> Three different chemicals are compared on their ability to make fabric stain resistant. Four bolts of cloth , manufactured weeks apart, are used. Because the results are expected to vary from bolt of cloth to bolt, three small samples are cut from each b
> The iris data described in Example 6 are given in the stem-and-leaf diagrams below. The MINITAB output for the analysis of the iris data is given below. One-way ANOVA : (a) Identify the SSE and its degrees of freedom . Also locates. (b) Check the calcul
> Using the computer. MINITAB can be used for ANOVA. With the data from three treatments entered in columns 1-3 The Output is as follows: Use computer software to analyze the moisture data.
> A campus area merchant recorded the number of bad checks received per month, for five months 4 5 4 7 6 Calculate: (a) The sample variance. (b) The sample standard deviation.
> As part of the multilab study, four fabrics are tested for flammability at the National Bureau of Standards. The following burn times in seconds are recorded after a paper tab is ignited on the hem of a dress made of each fabric. (a) State the statistica
> Refer to the data on travel expenses and the F-test. It is the ordering of the population means, and the sizes of their differences, that is the key finding of study. (a) Calculate 95% simultaneous confidence intervals for the differences in means. (b)
> Compute the sums of squares and construct the ANOVA table for the data given in Exercise 14.31. Use software to verify your ANOVA table. Data from Exercise 14.31: Food scientists investigated whether making a cheese sauce by a continuous process or bat
> Food scientists investigated whether making a cheese sauce by a continuous process or batch process made any difference to taste. They also included a third treatment, a carefully selected ideal product, that served as a control. Treatment I is the ideal
> A large organization is being investigated to determine if its recruitment is sex-biased. Tables 15 and 16, respectively, show the classification of applicants for secretarial and for sales positions according to gender and result of interview. Table 17
> A random sample of 130 business executives was classified according to age and the degree of risk aversion as measured by a psychological test. Do these data demonstrate an association between risk aversion and age?
> By polling a random sample of 350 undergraduate students, a campus press obtains the following frequency counts regarding student attitude toward a proposed change in dormitory regulations. Are attitude toward the proposal and gender associated?
> In a study on the effect of diet and lifestyle on heart disease, 96 patients with severe coronary blockage were randomly assigned, 49 to an experimental group and 4 7 to a control group. The patients in the experimental group had a low-fat vegetarian die
> Using the data for drugs l and 3 in Exercise 13.33, make a 2 * 2 contingency table and test H0 : p1 = p3 versus H 1 : p1 ≠p3 at a = .05 employing: (a) The x2 test. (b) The Z test. Data from Exercise 13.33: To compare the effectivene
> To compare the effectiveness of four drugs in relieving postoperative pain, an experiment was done by randomly assigning 195 surgical patients to the drugs under study. Recorded here are the number of patients assigned to each drug and the number of pati
> Find the standard deviation of the measurements of diameters given in Exercise 2.45. Data from Exercise 2.45: The following measurements of the diameters (in feet) of Indian mounds in southern Wisconsin were gathered by examining reports in the Wisconsi
> Refer to the data in Exercise 13.31. (a) Use the Z test for testing the equality of two population proportions with a two-sided alternative. Verify the relation x2 = Z2 by comparing their numerical values. (b) If the alternative is that the incidence r
> Refer to Exercise 3.48 and the data concerning a vaccine for type B hepatitis. Do these data indicate that there is a different rate of incidence of hepatitis between the vaccinated and nonvaccinated participants? Use the x2 test for homogeneity in a con
> Referring to the data for site 3 and site 4 in Exercise 13.29, make a 2 * 2 table and test H0 : p3 = p4 versus H1 : p3 > p4 at a = .05. (a) Is there strong evidence that the probability a paper will be taken from the drop site is higher for site 3 th
> A community paper in the Spanish language was delivered to many sites in the San Francisco Bay area. As a check on the circulation numbers that are important to advertisers, a survey was conducted at four drop sites. The number of papers delivered to eac
> The following table records the observed number of births at a hospital in four consecutive quarterly periods. It is conjectured that twice as many babies are born during the Jan.-March quarter than any of the other three quarters. At 
> To examine the quality of a random number generator, frequency counts of the individual integers are recorded from an output of 500 integers. The concept of randomness implies that the integers 0, 1, . . . , 9 are equally likely. Based on the observed fr
> Refer to the physical conditioning data given in Data Bank. Use MINITAB or some other package to fit a regression of the final number of sit-ups on the initial number of sit-ups and the gender of the student.
> Recorded here are the scores x1 and x2 in two midterm examinations, the GPA x3, and the final examination score y for 20 students in a statistics class. (a) Ignoring the data of GPA and the first midterm score, fit a simple linear regression of y on x2.
> A forester seeking information on basic tree dimensions obtains the following measurements of the diameters 4.5 feet above the ground and the heights of 12 sugar maple trees ( courtesy of A. Ek). The forester wishes to determine if the diameter measureme
> Refer to the data of speed x and stopping distance y given in Table I. The MINITAB commands for fitting a straight line regression to y’ = √y and x are (a) Obtain the computer output and identify the equation of the fi

