Question: Four upper level undergraduate students are
Four upper level undergraduate students are available to serve on a committee.
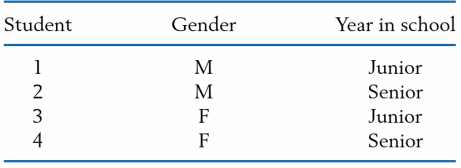
Two students will be selected at random to serve on the committee. Let
A = The students selected are of the same gender.
B = The students selected are the same year in school.
(a) Make a Venn diagram showing the outcomes and the two events.
(b) Find the probability of A U B.
(c) Are A and B independent? Explain why or why not.
(d) Find the probability of AB.
> A sample of six university students responded to the question "H ow much time, in minutes, did you spend on the social network site yesterday?" One student never used the site and was dropped from the study. 100 45 60 130 30 Calculate, using these five v
> Many college students obtain college degree credits by demonstrating their proficiency on exams developed as part of the College Level Examination Program (CLEP). Based on their scores on the College Qualification Test (CQT), it is helpful if students co
> Refer to Exercise 11.44. (a) Construct a 95% confidence interval for the slope of the regression line. (b) Obtain a 90% confidence interval for the expected y value corresponding to x = 4 days. Data from Exercise 11.44: Last week's total number of hou
> Refer to Exercise 11.44. (a) Find the residuals. (b) Calculate the SSE by (i) summing the squares of the residuals and also (ii) using the formula SSE = Syy – S2xy / Sxx. (c) Estimate the error variance. Data from Exercise 11.44: Las
> Last week's total number of hours worked by a student, y, depends on the number of days, x, he reported to work last week. Suppose the data from nine students provided (a) Plot the scatter diagram. (b) Calculate x, y, Sxx, Syy , and Sxy. (c) Determine t
> Concerns that were raised for the environment near a government facility led to a study of plants. Since leaf area is difficult to measure, the leaf area ( cm2 ) was fit to x = Leaf length * Leaf width using a least squares approach. For data collected
> Students can bike to a park on the other side of a lake by going around one side of the lake or the other. After much discussion about which was faster, they decided to perform an experiment. Among the 12 students available, 6 were randomly selected to f
> Two scales are available at a campus athletic facility. A student wonders if, on average, they give the same reading for weight. She and four others weigh themselves on both scales. The readings are (a) Find a 95% confidence interval for the mean differe
> A sample of river water is divided into two specimens. One is randomly selected to be sent to Lab A and the other is sent to Lab B. This is repeated for a total of nine times. The measurement of suspended solids at Lab B is subtracted from that of Lab A
> A driver is stopped for erratic driving, and the alcohol content of his blood is checked. Specify the sample space and the event A = [ level exceeds legal limit ] if the legal limit is .10%.
> Examine each of these probability assignments and state what makes it improper. (a) Concerning tomorrow's weather, P( Rain) = .4 P ( Cloudy but no rain) = . 5 P( Sunny) = .2 (b) Concerning your passing of the statistics course, P( Pass) = 1.1 P( Fa
> For the data of Exercise 2.57, calculate s2 by using the alternative formula. Data from Exercise 2.57: For the data set 6 2 4
> Identify these events in the corresponding parts of Exercise 4.95. (a) At most 7 commercials. (b) Less than 18 .5 hours. (c) At least 30% visited a site. Data from Exercise 4.95: Describe the sample space for each of the following experiments. (a) T
> In order to keep up with the demand for its new earphones, a manufacturer h ad to purchase a key p art from three different suppliers. Supplier l provides 15% of the parts and 10% are defective. Supplier 2 provides 60% of the parts and 4% are defective.
> Identity theft is a growing problem in the United States. According to a Federal Trade Commission Report about 280,000 identity complaints were filed in a recent year. Among the 43.2 million persons in the 20- 29 year old age group, 56,689 complaints wer
> An e-commerce electronics firm sent 80% of its orders by a parcel service that delivers late only 3% of the time. It sends the other 20% of items by a combination bus service and local transportation that delivers late 6% of the time. Find the (a) The p
> Refer to the Statistics in Context discussion about space junk. Change the probability of hitting to (a) .4 and repeat the calculation of probability for hitting your city. (b) .1 and repeat the calculation of probability for hitting your city.
> Mr. Hope, a character apprehended by Sherlock Holmes, was driven by revenge to commit two murders. He presented two seemingly identical pills, one containing a deadly poison, to an adversary who selected one while Mr. Hope took the other. The entire proc
> Refer to the probability t able given in Exercise 4.112 concerning three events A, B, and C. (a) Find the conditional probability of A given that B does not occur. (b) Find the conditional probability of B given that both A and C occur. (c) Determine
> Let A b e the event that a person is a binge drinker and B be the event that the person is female. For a person selected at random, a recent survey of the National Center for Health Statistics suggests the probabilities P(B) = .50 P(A IB) = .11 P(A IB)
> Refer to Exercise 4.118 for each pair of events given below, determine whether or not the events are independent. (a) A, C (b) AB,C Data from Exercise 4.118: Suppose three events A, B, and Care such that B and C are mutually exclusive and
> Suppose three events A, B, and Care such that B and C are mutually exclusive and (a) Show the events in a Venn diagram. (b) Determine the probabilities of all the intersections and mark them in the Venn diagram. (c) Find the probability that only one o
> Repeat (a) and (b) of Exercise 2.59 for the data set 2.5 1.7 2.1 1.5 1.7 Data from Exercise 2.59: For the data set 8 6 14 4 (a) Calculate the deviations (x - x) and check to see that they add up to 0. (b) Calculate the variance and the standard de
> Rap music was the favorite genre of 6 out of 56 students from a large Midwestern university. Identify a statistical population and the sample.
> Given P(AB) = .4 and P(B) = .5, find P(A IB). If, further, P(A) = .8, are A and B independent?
> Suppose a fair die has its even-numbered faces painted red and the odd-numbered faces are white. Consider the experiment of rolling the die once and the events A = [ 2 or 3 shows up ] B = [ Red face shows up ] Find the following probabilities: (a) P(A)
> Referring to Exercise 4.114 find the probability that: (a) B occurs and C does not occur. (b) At least one of the events A and B occurs . ( c) Exactly two of the events A , B, and C occur. Data from Exercise 4.114: Concerning three events A, B, and C
> Concerning three events A, B, and C, the following probabilities are specified. Draw a Venn diagram and determine the probabilities of all the intersections that appear in the diagram.
> Referring to Exercise 4.112 describe each event in the context of the problem and calculate the probabilities of the following events. (a) Both B and C occur. (b) Either B or C occurs. (c) B occurs and C does not occur. (d) Only one of the three even
> Let the three events A, B, and C represent the cases that a randomly selected student is good at answering multiple choice, essay, and mathematical questions, respectively. The probabilities of the various intersections are given in the accompanying tabl
> Using event relations, express the following events in terms of the three events A, B, and C. (a) All three events occur. (b) At least one of the three events occurs. (c) A and B occur and C does not. (d) Only B occurs.
> From the probabilities exhibited in this Venn diagram, find P(A), P(AB), P(B U C), and P(BC).
> Suppose each of the numbers .2, .4, and .6 represents the probability of one of the events A, AB, and A U B. Connect the probabilities to the appropriate events.
> Express the following statements in the notations of the event operations. (a) A occurs and B does not. (b) N either A nor B occurs. (c) Exactly one of the events A and B occurs.
> For the data set 8 6 14 4 (a) Calculate the deviations (x - x) and check to see that they add up to 0. (b) Calculate the variance and the standard deviation.
> In checking the conditions of a used car, let A denote the event that the car has a faulty transmission, B the event that it has faulty brakes, and C the event that it has a faulty exhaust system. Describe in words what the following events represent: (a
> A three-digit number is formed by arranging the digits 2, 4, and 5 in a random order. (a) List the sample space. (b) Find the probability of getting a number less than 400. (c) What is the probability that an even number is obtained?
> Does the uniform model apply to the following observations? Explain. (a) Day of week on which the most persons depart by airplane from Chicago. (b) Day of week on which the monthly low temperature occurs. (c) Day of week on which the maximum amount of
> Chevalier de Mere, a French nobleman of the seventeenth century, reasoned that in a single throw of a fair die, P ( 1 ) = 1/6, so in two throws, P ( l appears at least once ) = 1/6 + 1/6 = 1/3. What is wrong with the above reasoning?
> Refer to Exercise 4.102. Instead of a completely random choice, suppose a plot is chosen at random from each row and assigned to variety a. Find the probability that the plots receiving a are in the same column. Data from Exercise 4.102: To compare two
> To compare two varieties of wheat, say, a and b, a field trial will be conducted on four square plots located in two rows and two columns. Each variety will be planted on two of these plots. (a) List all possible assignments for variety a. (b) If the as
> There are four tickets numbered 1, 2, 3, and 4. Suppose a two-digit number will be formed by first drawing one ticket at random and then drawing a second ticket at random from the remaining three. (For instance, if the first ticket drawn shows 3 and the
> The Wimbledon men 's tennis championship ends when one player wins three sets. (a) How many elementary outcomes end in three sets? In four? (b) If the players are evenly matched, what is the probability that the tennis match ends in four sets?
> It is somewhat surprising to learn the probability that 2 persons in a class share the same birthday. As an approximation, assume that the 365 days are equally likely birthdays. (a) What is the probability that, among 3 persons, at least 2 have the same
> An urn contains 4 red and 6 green balls. One ball is drawn at random and its color is observed. The ball is then returned to the urn, and 3 new balls of the same color are added to the urn. A second ball is then randomly drawn from the urn that now conta
> Repeat (a) and (b) of Exercise 2.57 for the data set 5 9 -2 Data from Exercise 2.57: For the data set 6 2 4 (a) Calculate the deviations (x - x) and check to see that they add up to 0. (b) Calculate the sample variance and the standard deviation. (c)
> An IRS auditor receives a batch of 20 tax returns that were flagged by a computer program for possible tax evasions. Suppose, unknown to the agent, 8 of these returns have illegal deductions and the other 12 are in good standing. If the agent randomly se
> In all of William Shakespeare's works, he used 884,647 different words. Of these, 14,376 appeared only once and 4343 appeared twice. If one word is randomly selected from a list of these 884,647 different words: (a) What is the probability that the sele
> A local moving company owns 12 trucks. Three are randomly selected for compliance with emission standards and all are found to be noncompliant. The company argues that these are the only three that do not meet the standards. Calculate the probability tha
> In an optical sensory experiment, a subject shows a fast response ( F ), a delayed response ( D ), or no response at all ( N ). The experiment will be performed on two subjects. (a) Using a tree diagram, list the sample space. (b) Suppose, for each sub
> Refer to the data on malt extract in the Data Bank. (a) Obtain sample mean and standard deviation. (b) Obtain quartiles. (c) Check conformity with the empirical rule.
> Refer to Exercise 2.124. (a) Obtain the quartiles. (b) Obtain the 90th percentile. How many of the alligators above the 90th percentile are female? Data from Exercise 2.124: Refer to the alligator data in the Data Bank. Using the data on x5 for thirty-
> Refer to the alligator data in the Data Bank. Using the data on x5 for thirty-seven alligators: (a) Make a histogram. (b) Obtain the sample mean and standard deviation.
> The salmon fisheries support a primary industry in Alaska and their management is of high priority. Salmon are born in freshwater rivers and streams but then swim out into the ocean for a few years before returning to spawn and die. In order to identify
> Find x and s for the final times to run 1.5 miles in the Data Bank.
> For the data set 6 2 4 (a) Calculate the deviations (x - x) and check to see that they add up to 0. (b) Calculate the sample variance and the standard deviation. (c) Check your answers in Part b using software. R: x=c (6, 2, 4) then mean(x) and sd(x)
> Find x and s for the data set in Table 4.
> Lumber intended for building houses and other structures must be monitored for strength. The measurement of strength (pounds per square inch) for 61 specimens of Southern Pine (Source: U.S. Forest Products Laboratory) yielded produces a rather complete s
> Find x¯ and s for: (a) The lizard data in Exercise 2.19. (b) The acid rain data in Exercise 2.112. Data from Exercise 2.19: A zoologist collected wild lizards in the Southwestern United States. Thirty lizards from the genus Phrynosoma were
> Refer to the duration of power outage data. Obtain the mean and standard deviation of the duration of outage.
> Refer to the polar bear data. Obtain the mean and standard deviation of weight. R: mean(x) sd(x) where x = Dat$weight
> The mode of a collection of observations is defined as the observed value with largest relative frequency. The mode is sometimes used as a center value. There can be more than one mode in a data set. Find the mode for the checked bag data given in Exerci
> Referring to the wolf data, explain why it is not reasonable to group the data into a frequency distribution.
> The Dow Jones average provides an indication of overall market level. The changes in this average, ( current year) -(previous year) summarize the year's activity. Changes for 48 recent years yield the following frequency table. The left-hand endpoint is
> Refer to Exercise 2. 112. (a) Determine the intervals x¯ ± s, x¯ ± 2 s, and x¯ ± 3 s. (b) What proportions of the measurements lie in those intervals? (c) Compare your findings with the empirical guidelines for bell-shaped distributions.
> The 50 measurements of acid rain in Wisconsin, whose histogram is given on page 18 are (a) Calculate the median and quartiles. (b) Find the 90th percentile. (c) Determine the mean and standard deviation. (d) Display the data in the form of a boxplot.
> Refer to the alligator data of the Data Bank. Using the data on testosterone x4 from Lake Apopka: (a) Make separate dot plots for the male and female alligators. (b) Calculate the sample means for each group. (c) Do the concentrations of testosterone
> A data set has summary statistics x = 19.5 s = 6.0 Median = 16 .0 Q1 = 4.0 Q4 = 24.5 Approximately what proportion of the observations are (a) Below 24.5? (b) Above 4.0? (c) In the interval 7.5-31.5? ( d) In the interval 4.0-24.5? (e) In the interval
> To study how first-grade students utilize their time when assigned to a math task, a researcher observes 24 students and records their times off-task out of 20 minutes. For this data set, find: (a) Mean and standard deviation. (b) Median. (c) Range.
> The data below were obtained from a detailed record of purchases of toothpaste over several years ( courtesy of A. Banerjee). The usage times (in weeks) per ounce of toothpaste for a household taken from a consumer panel were . 74 .45 .80 .95 .84 .82 .7
> In a genetic study, a regular food was placed in each of 20 vials and the number of flies of a particular genotype feeding on each vial recorded. The counts of flies were also recorded for another set of 20 vials that contained grape juice. The following
> The boxplot and summary statistics for data from 48 student on the time spent, in minutes, at a social network site the previous day are (a) From the boxplot, determine whether or not the distribution of values is nearly symmetric, has a long tail to the
> (a) Calculate x and s for the data 3 5 4 8. (b) Consider the data set 103 105 104 108, which is obtained by adding 100 to each number given in part. (a). Use your results from part (a) and the properties in Exercises 2.52 and 2.74 to obtain x and s for t
> The following table shows the age at inauguration of each U.S. president. (a) Make a stem-and-leaf display with a double stem. (b) Find the median, Q1 and Q3.
> The following are the numbers of passengers on the minibus tour of Hollywood. 9 12 10 11 11 7 12 6 11 4 10 10 11 9 10 7 10 8 8 9 8 9 11 9 8 6 10 6 8 11 (a) Find the sample median. (b) Find the sample mean. (c) Find the sample variance.
> The stem-and-leaf display shows the final examination scores of 33 students in a geology course. (Leaf unit = 1.0) (a) Find the median score. (b) Find the quartiles. (c) What proportion of the students scored below 70? What proportion scored 80 or above
> The weights of twenty adult grizzly bears captured and released are summarized in the computer output (a) Locate two measures of center tendency, or location, and interpret the values. (b) Locate the standard deviation. (c) Calculate the z score for a g
> Refer to the alligator data of the Data Bank. Using the data on testosterone x 4 for male alligators: (a) Make separate dot plots for the Lake Apopka and Lake Woodruff alligators. (b) Calculate the sample means for each group. (c) Do the concentration
> Mung bean sprouts are more widely used in Asian cooking than the beans themselves. To study their growth, an experimenter presoaked some beans until they sprouted about 1 millimeter. Five were randomly selected and placed in individual petri dishes. Afte
> The dollar amounts claimed by businessmen for their lunches are to be grouped into the following classes: 0-5, 5-10, 10-15, 15-20, 20 or more. The left endpoint is included. Is it possible to determine from this frequency distribution the exact number o
> Refer to the data on power outages in the Data Bank. Make a Pareto chart for the cause of the outage.
> Referring to Exercise 2.97, plot the dot diagrams of heights separately for the male and female students and compare. Data from Exercise 2.97: Table 13 gives data collected from the students attending an elementary statistics course at the University of
> Table 13 gives data collected from the students attending an elementary statistics course at the University of Wisconsin. These data include sex, height, number of years in college, and the general area of intended major [Humanities (H); Social Science (
> For the experiments in Exercise 4.95, which sample spaces are discrete and which are continuous? Data from Exercise 4.95: Describe the sample space for each of the following experiments. (a) The number of different commercials shown next time you watch
> Describe the sample space for each of the following experiments. (a) The number of different commercials shown next time you watch your favorite one-hour show. (b) The time your smartphone will last following an overnight charge. (c) A sample of 30 st
> In each of the following cases, how would you select the experimental units and conduct the experiment-matched pairs or independent samples? (a) Compare the mileage obtained from two gasolines. Twelve SUVs of various sizes are available. (b) Compare the
> Refer to the problem stated in Exercise 10.64, but now suppose that the study was conducted at 16 farms, of which 8 were selected for planting strain A and the other 8 for strain B. Here also the plots used were all of equal sizes. Recorded below are the
> To compare the crop yields from two strains of wheat, A and B, an experiment was conducted at eight farms located in different parts of a state. At each farm, strain A was grown on one plot and strain B on another; all 16 plots were of equal sizes. Given
> The mean and median salaries for middle management employees at two similar companies A and B in an area are as follows: Assume that the salaries are set in accordance with job competence and the overall quality of workers is about the same in the two co
> Refer to the computer attitude scores (CAS) of students given in Table D.4 of the Data Bank. A computer analysis produces the output (a) What is the conclusion to testing the equality of mean computer attitude scores at level a = .05? (b) Find a 95% con
> Refer to the data on the weight of wolves in Data Bank. A computer analysis produces the output (a) What is the conclusion to testing the equality of mean weights at level a = .05? (b) Test the null hypothesis that males weigh an average of 5 pounds mor
> Refer to Exercise 10.52 but suppose, instead, that the sample sizes are 9 and 8 with the same summary statistics: From A1: x = 9.7, s1 = 3.1 From A2: x = 6.5, s2 = 1.3 (a) Test, with the approximate t procedure, that the population means are different. U
> Referring to Exercise 10.59, construct an approximate t 95% confidence interval for the difference in mean yields between the new spray and the standard spray. Data from Exercise 10.59: A fruit grower wishes to evaluate a new spray that is claimed to re
> A fruit grower wishes to evaluate a new spray that is claimed to reduce the loss due to damage by insects. To this end, he performs an experiment with 27 trees in his orchard by treating 12 of those trees with the new spray and the other 15 trees with th
> Given the following two samples, 6 9 3 3 7 8 and 4 2 3 3 obtain (a) s2pooled and (b) the value of the t statistic for testing H0 : µ1 - µ2 = 1. State the d.f. of the t.
> Obtain s2pooled for the gaming data.
> Consider the data of Exercise 10.55. (a) Construct a 90% confidence interval for µA - µB. (b) Give a 95% confidence interval for µA using the data of drug A alone. Data from Exercise 10.55: A study of postoperative
> A study of postoperative pain relief is conducted to determine if drug A has a significantly longer duration of pain relief than drug B. Observations of the hours of pain relief are recorded for 55 patients given drug A and 58 patients given drug B. The
> Refer to the data in Exercise 10.53. Suppose you wish to establish that the mean response of 35-44 year old is larger than that of 19- 24 year old by more than 150 dollars. (a) Formulate the null hypothesis and the alternative hypothesis. (b) State the
> On a day, the noon temperature measurements (in °F) reported by five weather stations in a st ate were 74 80 76 76 73 (a) Find the mean and median temperature in °F. (b) The Celsius (0 C) scale is related to the Fahrenheit (° F) scale by C = 5/9 (F

