Question: A fruit grower wishes to evaluate a
A fruit grower wishes to evaluate a new spray that is claimed to reduce the loss due to damage by insects. To this end, he performs an experiment with 27 trees in his orchard by treating 12 of those trees with the new spray and the other 15 trees with the standard spray. From the data of fruit yield (in pounds) of those trees, the following summary statistics were found.
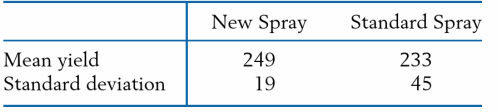
Do these data substantiate the claim that a higher yield should result from the use of the new spray? State the assumptions you make and test at a = .05.
> Repeat (a) and (b) of Exercise 2.57 for the data set 5 9 -2 Data from Exercise 2.57: For the data set 6 2 4 (a) Calculate the deviations (x - x) and check to see that they add up to 0. (b) Calculate the sample variance and the standard deviation. (c)
> An IRS auditor receives a batch of 20 tax returns that were flagged by a computer program for possible tax evasions. Suppose, unknown to the agent, 8 of these returns have illegal deductions and the other 12 are in good standing. If the agent randomly se
> In all of William Shakespeare's works, he used 884,647 different words. Of these, 14,376 appeared only once and 4343 appeared twice. If one word is randomly selected from a list of these 884,647 different words: (a) What is the probability that the sele
> A local moving company owns 12 trucks. Three are randomly selected for compliance with emission standards and all are found to be noncompliant. The company argues that these are the only three that do not meet the standards. Calculate the probability tha
> Four upper level undergraduate students are available to serve on a committee. Two students will be selected at random to serve on the committee. Let A = The students selected are of the same gender. B = The students selected are the same year in schoo
> In an optical sensory experiment, a subject shows a fast response ( F ), a delayed response ( D ), or no response at all ( N ). The experiment will be performed on two subjects. (a) Using a tree diagram, list the sample space. (b) Suppose, for each sub
> Refer to the data on malt extract in the Data Bank. (a) Obtain sample mean and standard deviation. (b) Obtain quartiles. (c) Check conformity with the empirical rule.
> Refer to Exercise 2.124. (a) Obtain the quartiles. (b) Obtain the 90th percentile. How many of the alligators above the 90th percentile are female? Data from Exercise 2.124: Refer to the alligator data in the Data Bank. Using the data on x5 for thirty-
> Refer to the alligator data in the Data Bank. Using the data on x5 for thirty-seven alligators: (a) Make a histogram. (b) Obtain the sample mean and standard deviation.
> The salmon fisheries support a primary industry in Alaska and their management is of high priority. Salmon are born in freshwater rivers and streams but then swim out into the ocean for a few years before returning to spawn and die. In order to identify
> Find x and s for the final times to run 1.5 miles in the Data Bank.
> For the data set 6 2 4 (a) Calculate the deviations (x - x) and check to see that they add up to 0. (b) Calculate the sample variance and the standard deviation. (c) Check your answers in Part b using software. R: x=c (6, 2, 4) then mean(x) and sd(x)
> Find x and s for the data set in Table 4.
> Lumber intended for building houses and other structures must be monitored for strength. The measurement of strength (pounds per square inch) for 61 specimens of Southern Pine (Source: U.S. Forest Products Laboratory) yielded produces a rather complete s
> Find x¯ and s for: (a) The lizard data in Exercise 2.19. (b) The acid rain data in Exercise 2.112. Data from Exercise 2.19: A zoologist collected wild lizards in the Southwestern United States. Thirty lizards from the genus Phrynosoma were
> Refer to the duration of power outage data. Obtain the mean and standard deviation of the duration of outage.
> Refer to the polar bear data. Obtain the mean and standard deviation of weight. R: mean(x) sd(x) where x = Dat$weight
> The mode of a collection of observations is defined as the observed value with largest relative frequency. The mode is sometimes used as a center value. There can be more than one mode in a data set. Find the mode for the checked bag data given in Exerci
> Referring to the wolf data, explain why it is not reasonable to group the data into a frequency distribution.
> The Dow Jones average provides an indication of overall market level. The changes in this average, ( current year) -(previous year) summarize the year's activity. Changes for 48 recent years yield the following frequency table. The left-hand endpoint is
> Refer to Exercise 2. 112. (a) Determine the intervals x¯ ± s, x¯ ± 2 s, and x¯ ± 3 s. (b) What proportions of the measurements lie in those intervals? (c) Compare your findings with the empirical guidelines for bell-shaped distributions.
> The 50 measurements of acid rain in Wisconsin, whose histogram is given on page 18 are (a) Calculate the median and quartiles. (b) Find the 90th percentile. (c) Determine the mean and standard deviation. (d) Display the data in the form of a boxplot.
> Refer to the alligator data of the Data Bank. Using the data on testosterone x4 from Lake Apopka: (a) Make separate dot plots for the male and female alligators. (b) Calculate the sample means for each group. (c) Do the concentrations of testosterone
> A data set has summary statistics x = 19.5 s = 6.0 Median = 16 .0 Q1 = 4.0 Q4 = 24.5 Approximately what proportion of the observations are (a) Below 24.5? (b) Above 4.0? (c) In the interval 7.5-31.5? ( d) In the interval 4.0-24.5? (e) In the interval
> To study how first-grade students utilize their time when assigned to a math task, a researcher observes 24 students and records their times off-task out of 20 minutes. For this data set, find: (a) Mean and standard deviation. (b) Median. (c) Range.
> The data below were obtained from a detailed record of purchases of toothpaste over several years ( courtesy of A. Banerjee). The usage times (in weeks) per ounce of toothpaste for a household taken from a consumer panel were . 74 .45 .80 .95 .84 .82 .7
> In a genetic study, a regular food was placed in each of 20 vials and the number of flies of a particular genotype feeding on each vial recorded. The counts of flies were also recorded for another set of 20 vials that contained grape juice. The following
> The boxplot and summary statistics for data from 48 student on the time spent, in minutes, at a social network site the previous day are (a) From the boxplot, determine whether or not the distribution of values is nearly symmetric, has a long tail to the
> (a) Calculate x and s for the data 3 5 4 8. (b) Consider the data set 103 105 104 108, which is obtained by adding 100 to each number given in part. (a). Use your results from part (a) and the properties in Exercises 2.52 and 2.74 to obtain x and s for t
> The following table shows the age at inauguration of each U.S. president. (a) Make a stem-and-leaf display with a double stem. (b) Find the median, Q1 and Q3.
> The following are the numbers of passengers on the minibus tour of Hollywood. 9 12 10 11 11 7 12 6 11 4 10 10 11 9 10 7 10 8 8 9 8 9 11 9 8 6 10 6 8 11 (a) Find the sample median. (b) Find the sample mean. (c) Find the sample variance.
> The stem-and-leaf display shows the final examination scores of 33 students in a geology course. (Leaf unit = 1.0) (a) Find the median score. (b) Find the quartiles. (c) What proportion of the students scored below 70? What proportion scored 80 or above
> The weights of twenty adult grizzly bears captured and released are summarized in the computer output (a) Locate two measures of center tendency, or location, and interpret the values. (b) Locate the standard deviation. (c) Calculate the z score for a g
> Refer to the alligator data of the Data Bank. Using the data on testosterone x 4 for male alligators: (a) Make separate dot plots for the Lake Apopka and Lake Woodruff alligators. (b) Calculate the sample means for each group. (c) Do the concentration
> Mung bean sprouts are more widely used in Asian cooking than the beans themselves. To study their growth, an experimenter presoaked some beans until they sprouted about 1 millimeter. Five were randomly selected and placed in individual petri dishes. Afte
> The dollar amounts claimed by businessmen for their lunches are to be grouped into the following classes: 0-5, 5-10, 10-15, 15-20, 20 or more. The left endpoint is included. Is it possible to determine from this frequency distribution the exact number o
> Refer to the data on power outages in the Data Bank. Make a Pareto chart for the cause of the outage.
> Referring to Exercise 2.97, plot the dot diagrams of heights separately for the male and female students and compare. Data from Exercise 2.97: Table 13 gives data collected from the students attending an elementary statistics course at the University of
> Table 13 gives data collected from the students attending an elementary statistics course at the University of Wisconsin. These data include sex, height, number of years in college, and the general area of intended major [Humanities (H); Social Science (
> For the experiments in Exercise 4.95, which sample spaces are discrete and which are continuous? Data from Exercise 4.95: Describe the sample space for each of the following experiments. (a) The number of different commercials shown next time you watch
> Describe the sample space for each of the following experiments. (a) The number of different commercials shown next time you watch your favorite one-hour show. (b) The time your smartphone will last following an overnight charge. (c) A sample of 30 st
> In each of the following cases, how would you select the experimental units and conduct the experiment-matched pairs or independent samples? (a) Compare the mileage obtained from two gasolines. Twelve SUVs of various sizes are available. (b) Compare the
> Refer to the problem stated in Exercise 10.64, but now suppose that the study was conducted at 16 farms, of which 8 were selected for planting strain A and the other 8 for strain B. Here also the plots used were all of equal sizes. Recorded below are the
> To compare the crop yields from two strains of wheat, A and B, an experiment was conducted at eight farms located in different parts of a state. At each farm, strain A was grown on one plot and strain B on another; all 16 plots were of equal sizes. Given
> The mean and median salaries for middle management employees at two similar companies A and B in an area are as follows: Assume that the salaries are set in accordance with job competence and the overall quality of workers is about the same in the two co
> Refer to the computer attitude scores (CAS) of students given in Table D.4 of the Data Bank. A computer analysis produces the output (a) What is the conclusion to testing the equality of mean computer attitude scores at level a = .05? (b) Find a 95% con
> Refer to the data on the weight of wolves in Data Bank. A computer analysis produces the output (a) What is the conclusion to testing the equality of mean weights at level a = .05? (b) Test the null hypothesis that males weigh an average of 5 pounds mor
> Refer to Exercise 10.52 but suppose, instead, that the sample sizes are 9 and 8 with the same summary statistics: From A1: x = 9.7, s1 = 3.1 From A2: x = 6.5, s2 = 1.3 (a) Test, with the approximate t procedure, that the population means are different. U
> Referring to Exercise 10.59, construct an approximate t 95% confidence interval for the difference in mean yields between the new spray and the standard spray. Data from Exercise 10.59: A fruit grower wishes to evaluate a new spray that is claimed to re
> Given the following two samples, 6 9 3 3 7 8 and 4 2 3 3 obtain (a) s2pooled and (b) the value of the t statistic for testing H0 : µ1 - µ2 = 1. State the d.f. of the t.
> Obtain s2pooled for the gaming data.
> Consider the data of Exercise 10.55. (a) Construct a 90% confidence interval for µA - µB. (b) Give a 95% confidence interval for µA using the data of drug A alone. Data from Exercise 10.55: A study of postoperative
> A study of postoperative pain relief is conducted to determine if drug A has a significantly longer duration of pain relief than drug B. Observations of the hours of pain relief are recorded for 55 patients given drug A and 58 patients given drug B. The
> Refer to the data in Exercise 10.53. Suppose you wish to establish that the mean response of 35-44 year old is larger than that of 19- 24 year old by more than 150 dollars. (a) Formulate the null hypothesis and the alternative hypothesis. (b) State the
> On a day, the noon temperature measurements (in °F) reported by five weather stations in a st ate were 74 80 76 76 73 (a) Find the mean and median temperature in °F. (b) The Celsius (0 C) scale is related to the Fahrenheit (° F) scale by C = 5/9 (F
> The responses, of persons in the first and third age groups to the average monthly amount charged, have the summary statistics Determine a 95% confidence interval for the difference of means.
> Two versions of a new simplified tax form, A1 and A2, need to be evaluated with respect to the time, in hours, it takes to complete the form. Forty persons were selected to fill out Form A1 and 40 were selected to fill out Form A2. The summary statistics
> Refer to the Data Bank. The responses, of persons in the first and second age groups, on the frequency of credit card use question, have the summary statistics (a) Obtain a 98% confidence interval for the difference in the two population mean frequency o
> Refer to the physical fitness data in the Data Bank. Find a 95% confidence interval for the mean difference of the pretest minus posttest number of sit-ups. Also test that the mean difference is zero versus a two-sided alternative with a = .05.
> Refer to the marine growth of salmon data in the Data Bank. Compare the mean growth of males and females by obtaining a 95% confidence interval for the difference of means and also test equality versus a two-sided alternative with a = .05.
> Use the approximate t-test to test the equality of means with the two samples x: 7 15 6 12 y: 12 8 6 11 8 (a) Calculate the sample means and variances by hand and use calculator to evaluate d.f and t. (b) Confirm your answer using computer software.
> Refer to the alligator data in the Data Bank. Using the data on testosterone x 4 for male alligators, compare the means for the two lake regions. (a) Should you pool the variances with these data? (b) Find a 90% confidence interval for the difference o
> We illustrate the MINITAB commands and output for the two-sample t t est. The approximate t test is performed if you don't click Assume equal variances. (a) From the output, what is the conclusion to testing H0 : µ1 - µ2 = 0 ver
> A study ( courtesy of R. Golubjatnikov) is undertaken to compare the rates of prevalence of CF antibody to parainfluenza I virus among boys and girls in the age group 5 to 9 years. Among 113 boys tested, 34 are found to have the antibody; among 139 girls
> 1. If a fixed number c is added to all measurements in a data set, then the mean of the new measurements is c + (the original mean). 2. If all measurements in a data set are multiplied by a fixed number d, then the mean of the new measurements is d x
> Present the result that 158 male babies were born to 363 parents both of whom smoke. The same study found that 2685 male babies were born to 5045 parents, neither of which smoked. Obtain a 95% confidence interval of the increase in the proportion of male
> An experiment was conducted to study whether cloud seeding reduces the occurrences of h ail. At a hail-prone geographical area, seeding was done on 50 stormy days and another 155 stormy days were also observed without seeding. The following counts were o
> Suppose packages of cream cheese coming from an automated processor have weights that are normally distributed. For one day's production run, the mean is 8.2 ounces and the standard deviation is 0.1 ounce. (a) If the packages of cream cheese are labeled
> The daily number of kayaks sold, X, at a water sports store has the probability distribution (a) Find the expected number of kayaks sold in a day. (b) Find the standard deviation of the number of kayaks sold in a day. (c) Find the probability distributi
> A special purpose coating must have the proper abrasion. The standard deviation is known to be 21. Consider a random sample of 49 abrasion measurements. (a) Find the probability that the sample mean X¯ lies within 2 units of the population m
> Visitors to a popular Internet site rated the newest gaming console on a scale of 1 to 5 stars. The following probability distribution is proposed based on over 1400 individual ratings. (a) For a future random sample of 40 ratings, what are the mean and
> Refer to Exercise 7.43. Evaluate (a) P[X¯ > 2.2] (b) P[ 1.65 < X¯ < 2.25] Data from Exercise 7.43: A company that manufactures car mufflers finds that the labor to set up and run a nearly automatic machine has mean µ = 1.9 hours and ( = 1.2 hours. For
> A population consists of the four numbers { 0, 2, 4, 6 }. Consider drawing a random sample of size 2 with replacement. (a) List all possible samples and evaluate x for each. (b) Determine the sampling distribution of X. (c) Write down the population d
> Could the two density functions shown in Figure 11 be a population density function and that for the sampling distribution of X. Explain why or why not.
> The population density function and that for the sampling distribution of X, for n = 2, are shown in Figure 10. Identify which one is the sampling distribution and explain your answer.
> With reference to the water quality data in Exercise 2.1 7: (a) Find the sample median, first quartile, and third quartile. (b) Find the sample 90th percentile. Data from Exercise 2.17: The city of Madison regularly checks the water quality at swimmin
> A director of student counseling is interested in the relationship between the numerical score x and the social science score yon college qualification tests. The following data are recorded. (a) Plot the scatter diagram. (b) Calculate r.
> Use MINITAB or some other computer package to obtain the scatter diagram, correlation coefficient, and regression line of: (a) The final on the initial times to row given in Table. (b) Drop one unusual pair and repeat part (a). Comment on any major diffe
> For fitting body length to weight for all wolves given in table, use MINITAB or some other computer package to obtain: (a) The scatter diagram. (b) The correlation coefficient. (c) The regression line.
> We have illustrated the output from MINITAB commands for fitting a straight line. To create the scatter plot, without the fitted line, choose: Graph > Scatterplot. Choose Simple . Click OK. Type C2 in Y variables and C J in X variables. Click OK. Use MIN
> Identify the predictor variable x and the response variable y in each of the following situations. (a) The state highway department wants to study the relationship between road roughness and a car's gas consumption. (b) A concession salesperson at foot
> For samples collected concerning the following pairs of variables, decide whether you should make a scatter plot or create a contingency table. (a) The amount earned and the number of weeks worked during the last summer vacation. (b) Home ownership ( o
> Given these five pairs of values (a) Plot the scatter diagram. (b) From a visual inspection, draw a straight line that appears to fit the data well. (c) Compute the least squares estimates β^0, β^1 and draw the fitted line.
> Given the following ( x, y ) values (a) Make a scatter plot. (b) Calculate r.
> As part of a study of the psychobiological correlates of success in athletes, the following measurements ( courtesy of W. Morgan) are obtained from members of the U.S. Olympic wrestling team. (a) Plot the scatter diagram. (b) Calculate r. (c) Obtain the
> The tar yield of cigarettes is often assayed by the following method: A motorized smoking machine takes a two-second puff once every minute until a fixed butt length remains. The total tar yield is determined by laboratory analysis of the pool of smoke t
> The speedy lizard data, from Exercise 2.19, are (a) Find the sample median, first quartile, and third quartile. (b) Find the sample 90th percentile. Data from Exercise 2.19: A zoologist collected wild lizards in the Southwestern United States. Thirty l
> Among 40 adults 20- 25 years old questioned about stress levels, 16 responded they are more stressed now than last year. Identify a statistical population and the sample.
> Forest fires in the Western states are responsible for large losses. It was pointed out that the losses are greatest when many firefighters are present and least when there are only a few. Is this convincing evidence that losses can be cut by restricting
> Examine each of the following situations and state whether you would expect to find a high correlation between the variables. Give reasons why an observed correlation cannot be interpreted as a direct relationship between the variables and indicate at le
> Would you expect a positive, negative, or nearly zero correlation for each of the following? Give reasons for your answers. (a) The time a student spends playing computer games each week and the time they spend talking with friends in a group. (b) The
> A high-risk group of 1083 m ale volunteers was included in a major clinical trial for testing a new vaccine for type B hepatitis. The vaccine was given to 549 persons randomly selected from the group, and the others were inject ed with a neutral substanc
> A dealer's recent records of 80 truck sales provided the following frequency information on size of truck and type of drive. (a) Determine the marginal totals. (b) Obtain the table of relative frequencies. (c) Calculate the relative frequencies separate
> Concern over the quality of eyeglasses purchased over the internet led to a study where many glasses were individually ordered from several different online vendors. Among the lenses with only antireflective coating, 61 had a thickness at the center grea
> Sugar content (g) and carbohydrate content (g) are obtained from the package of the breakfast cereals. (a) Calculate the sample mean carbohydrates for all 30 cereals. (b) Construct a table using carbohydrates rather than sugar. (c) Calculate the relati
> Applicants for welfare are allowed an appeals process when they feel they have been unfairly treated. At the hearing, the applicant may choose self-representation or representation by an attorney. The appeal may result in an increase, decrease, or no cha
> A company that manufactures car mufflers finds that the labor to set up and run a nearly automatic machine has mean µ = 1.9 hours and ( = 1.2 hours. For a random sample of 36 runs. (a) Determine the mean and standard deviation of X¯. (b) What can you sa
> A random sample of size 150 is taken from the population of the ages of juniors enrolled at a large university during one semester. This population has mean 21.1 years and standard deviation 2.6. The population distribution is not normal. (a) Is it reas
> With reference to Exercise 2.48, calculate the quartiles. Data from Exercise 2.48: A large mail-order firm employs numerous persons to take phone orders. Computers on which orders are entered also automatically collect data on phone activity. One variab
> Suppose that the size of pebbles in a river bed is normally distributed with mean 12.1 mm and standard deviation 3.2 mm. A random sample of 9 pebbles are measured. Let X¯ denote the average size of the sampled pebbles. (a) What is the distribution of X¯

