Question: Match the vector fields F with the
Match the vector fields F with the plots labeled I–IV. Give reasons for your choices.
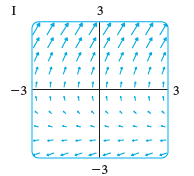
F (x, y) = 〈x, -y〉
Transcribed Image Text:
I 3 -3 3 -3
> Plot the vector field and guess where div F > 0 and where div F F(x, y) = (xy, x + y²)
> Let C be a simple closed smooth curve that lies in the plane x 1 y + z = 1. Show that the line integral ∫C z dx - 2x dy + 3ydz depends only on the area of the region enclosed by C and not on the shape of C or its location in the plane.
> Match the equations with the graphs labeled I–VI and give reasons for your answers. Determine which families of grid curves have u constant and which have v constant. I II ZA III IV ZA ZA V ZA VI z. r(u, v) = (u³ – u) i + v² j + u
> Verify that Stokes’ Theorem is true for the given vector field F and surface S. F (x, y, z) = -2yz i + y j + 3x k, S is the part of the paraboloid z = 5 - x2 - y2 that lies above the plane z = 1, oriented upward
> Evaluate the surface integral ∫∫S F ∙ dS for the given vector field F and the oriented surface S. In other words, find the flux of F across S. For closed surfaces, use the positive (outward) orientation. F (x, y, z) = y i + (z – y) j + x k, S is the sur
> (a). If C is the line segment connecting the point (x1, y1) to the point (x2, y2), show that (b). If the vertices of a polygon, in counterclockwise order, are (x1, y1), (x2, y2), . . . , (xn , yn), show that the area of the polygon is (c). Find the a
> Evaluate the surface integral. ∫∫S (x2 + y2 + z2) dS, S is the part of the cylinder x2 + y2 = 9 between the planes z = 0 and z = 2, together with its top and bottom disks
> Evaluate ∫C (y + sin x) dx + (z2 + cos y) dy + x3 dz where C is the curve r (t) =〈sin t, cos t, sin 2t〉, 0 < t < 2π . [Hint: Observe that C lies on the surface z = 2xy.]
> Identify the surface with the given vector equation. r (u, v) = u2 i + u cos v j + u sin v k
> Show that F is conservative and use this fact to evaluate ∫C F ∙ dr along the given curve. F(x, y, z) = e'i + (xe' + e*)j + ye k, Cis the line segment from (0, 2, 0) to (4, 0, 3)
> Let H be the hemisphere x2 + y2 + z2 = 50, z > 0, and suppose f is a continuous function with f (3, 4, 5) = 7, f (3, -4, 5) = 8, f -3, 4, 5) = 9, and f (-3, -4, 5) = 12. By dividing H into four patches, estimate the value of ∫∫H f (x, y, z) dS.
> Use Stokes’ Theorem to evaluate ∫∫S curl F dS. F (x, y, z) = x2 sin z i + y2 j + xy k, S is the part of the paraboloid z = 1 - x2 - y2 that lies above the xy-plane, oriented upward
> Use one of the formulas in (5) to find the area under one arch of the cycloid x = t2 sin t, y = 1 - cos t.
> Match the equations with the graphs labeled I–VI and give reasons for your answers. Determine which families of grid curves have u constant and which have v constant. I II ZA III IV ZA ZA V ZA VI z. x = sin u, y = cos u sin v, z=
> Match the equations with the graphs labeled I–VI and give reasons for your answers. Determine which families of grid curves have u constant and which have v constant. I II ZA III IV ZA ZA V ZA VI z. х— cos'и сos'p, у%3 sin'u cos',
> Match the equations with the graphs labeled I–VI and give reasons for your answers. Determine which families of grid curves have u constant and which have v constant. I II ZA III IV ZA ZA V ZA VI z. х%3 (1 — и)(3 + соs D) cos 4ти,
> Match the equations with the graphs labeled I–VI and give reasons for your answers. Determine which families of grid curves have u constant and which have v constant. I II ZA III IV ZA ZA V ZA VI z. r(u, ») — ир?і + и?o ј + (u? —
> Match the equations with the graphs labeled I–VI and give reasons for your answers. Determine which families of grid curves have u constant and which have v constant. I II ZA III IV ZA ZA V ZA VI z. r(u, v) = u cos vi + u sin vj +
> Use a computer to graph the parametric surface. Get a printout and indicate on its which grid curves have u constant and which have v constant. x = cos u, y = sin u sin v, z= cos v, 0 <u< 27, 0<v< 27
> Use a computer to graph the parametric surface. Get a printout and indicate on it which grid curves have u constant and which have v constant. x = sin v, y = cos u sin 4v, z = sin 2u sin 4v, 0 <u< 2m, -T/2 < v< T/2
> Show that F is conservative and use this fact to evaluate ∫C F ∙ dr along the given curve. F(x, y) = (4x³y² – 2xy) i + (2x*y – 3x²y² + 4y®)j. C: r(t) = (t + sin mt) i + (2t + cos Tt)j, 0 < t< 1
> Use a computer to graph the parametric surface. Get a printout and indicate on it which grid curves have u constant and which have v constant. r(u, v) = (u, sin(u+ v), sin v), -T <uE T, -T <V <T
> Use a computer to graph the parametric surface. Get a printout and indicate on it which grid curves have u constant and which have v constant. r(и, v) — (и*, и sin v, и cos v), -1 <u < 1, 0 <o< 27
> Identify the surface with the given vector equation. r (s, t) = 〈s cos t, s sin t, s〉
> A surface S consists of the cylinder x2 + y2 = 1, -1 Estimate the value of ∫∫S f (x, y, z) dS by using a Riemann sum, taking the patches Sij to be four quarter-cylinders and the top and bottom disks. f(±1, 0, 0
> Let S be the surface of the box enclosed by the planes x = ±1, y = ±1, z = ±1. Approximate ∫∫S cos (x + 2y + 3z) dS by using a Riemann sum as in Definition 1, taking the patches Sij to be the squares that are the faces of the box S and the points P*ij to
> Maxwell’s equations relating the electric field E and magnetic field H as they vary with time in a region containing no charge and no current can be stated as follows: where c is the speed of light. Use these equations to prove the fo
> Sketch the vector field F by drawing a diagram like Figure 5 or Figure 9. Figure 9: F (x, y, z) = -y i ZA
> Determine whether or not the given set is (a) open, (b) connected, and (c) simply-connected. {(x, y) | 1 < |x | < 2}
> (a). What happens to the spiral tube in Example 2 (see Figure 5) if we replace cos u by sin u and sin u by cos u? (b). What happens if we replace cos u by cos 2u and sin u by sin 2u?
> Show that F is a conservative vector field. Then find a function f such that F = ∇f. F(x, y, z) = sin yi + x cos yj – sin z k
> Show that the line integral is independent of path and evaluate the integral. ∫C sin y dx + (x cos y - sin y) dy, C is any path from (2, 0) to (1, π)
> Identify the surface with the given vector equation. r (u, v) = (u + v) i + (3 – v) j + (1 + 4u + 5v) k
> Determine whether the points P and Q lie on the given surface. r (u, v) = 〈1 + u - v, u + v2, u2 - v2〉 P (1, 2, 1), Q (2, 3, 3)
> Determine whether the points P and Q lie on the given surface. r (u, v) = 〈u + v, u - 2v, 3 + u – v〉 P (4, -5, 1), Q (0, 4, 6)
> A particle moves in a velocity field V (x, y) = 〈x^2, x, + y^2 〉 If it is at position s2, 1d at time t − 3, estimate its location at time t = 3.01.
> If you have a CAS that plots vector fields (the command is field plot in Maple and Plot Vector Field or Vector Plot in Mathematica), use it to plot F (x, y) = (y2 - 2xy) i +) (3xy - 6x2) j Explain the appearance by finding the set of points (x, y) such t
> Match the functions f with the plots of their gradient vector fields labeled I–IV. Give reasons for your choices. f (x, y) = (x + y)2 II 4 -4 4 -4
> Plot the gradient vector field of f together with a contour map of f. Explain how they are related to each other. f (x, y) = cos x - 2 sin y
> Match the vector fields F on R3 with the plots labeled I–IV. Give reasons for your choices. F (x, y, z) = x i + y j + z k IV z 0 z 0- -10 y 10-1
> (a). What is a function of two variables? (b). Describe three methods for visualizing a function of two variables.
> (a). What is a parametric surface? What are its grid curves? (b). Write an expression for the area of a parametric surface. (c). What is the area of a surface given by an equation z = t (x, y)?
> (a). Find the work done by the force field F (x, y) = x2 i + xy j on a particle that moves once around the circle x2 + y2 = 4 oriented in the counterclockwise direction. (b). Use a computer algebra system to graph the force field and circle on the same s
> (a). Evaluate the line integral ∫C F ∙ dr, where F (x, y) = ex-1 i + xy j and C is given by r(t) = t2 i + t3 j, 0 (b). Illustrate part (a) by using a graphing calculator or computer to graph C and the vectors from the
> Determine whether or not the given set is (a) open, (b) connected, and (c) simply-connected. {(x, y) | 1 < x2 + y2 < 4, y > 0}
> Use Green’s Theorem to prove the change of variables formula for a double integral (Formula 15.9.9) for the case where f (x, y) = 1: Here R is the region in the xy-plane that corresponds to the region S in the uv-plane under the trans
> Let F = ∇f, where f (x, y) = sin (x - 2y). Find curves C1 and C2 that are not closed and satisfy the equation. (a) f. F· dr = 0 JCI (b) f. (b) F. dr = 1
> Use the method of Example 5 to calculate ∫C F ∙ dr, where and C is any positively oriented simple closed curve that encloses the origin. F(x, y) = 2хyi + (у? — х?)j (x? + у?)?
> Is the vector field shown in the figure conservative? Explain.
> (a). How do you find the velocity, speed, and acceleration of a particle that moves along a space curve? (b). Write the acceleration in terms of its tangential and normal components.
> Determine whether or not the vector field is conservative. If it is conservative, find a function f such that F = ∇f. F (x, y, z) = ex sin yz i + zex cos yz j + yex cos yz k
> (a). Write the general form of a second-order homogeneous linear differential equation with constant coefficients. (b). Write the auxiliary equation. (c). How do you use the roots of the auxiliary equation to solve the differential equation? Write the fo
> Determine whether the statement is true or false. If it is true, explain why. If it is false, explain why or give an example that disproves the statement. 1. If y1 and y2 are solutions of y'' + y = 0, then y1 + y2 is also a solution of the equation. 2. I
> Test whether the regression explained by the model in Exercise 12.5 on page 450 is significant at the 0.01 level of significance. 1 Exercise 12.5: The electric power consumed each month by a chemical plant is thought to be related to the average ambient
> Test whether the regression explained by the model in Exercise 12.1 on page 450 is significant at the 0.01 level of significance. Exercise 12.1: A set of experimental runs was made to determine a way of predicting cooking time y at various values of ov
> Compute and interpret the coefficient of multiple determination for the variables of Exercise 12.1 on page 450. Exercise 12.1: A set of experimental runs was made to determine a way of predicting cooking time y at various values of oven width x1 and fl
> Use the data from Exercise 12.16 on page 453. (a) Estimate σ2 using the multiple regression of y on x1, x2, and x3, (b) Compute a 95% prediction interval for the observed gain with the three regressors at x1 = 15.0, x2 = 220.0, and x3 = 6.0.
> Suppose in Review Exercise 11.53 on page 437 that we were also given the number of class periods missed by the 12 students taking the chemistry course. The complete data are shown. (a) Fit a multiple linear regression equation of the form ˆ
> Using the data from Exercise 12.28, test the following at the 0.05 level. (a) H0: β1 = 0 versus H1: β1 = 0; (b) H0: β2 = 0 versus H1: β2 = 0. (c) Do you have any reason to believe that the model in Exercise
> Consider the following data from Exercise 12.13 on page 452. (a) Estimate σ2 using multiple regression of y on x1 and x2. (b) Compute predicted values, a 95% confidence interval for mean wear, and a 95% prediction interval for observed wear
> Using the data of Exercise 12.5 on page 450 and the estimate of σ2 from Exercise 12.19, compute 95% confidence intervals for the predicted response and the mean response when x1 = 75, x2 = 24, x3 = 90, and x4 = 98. Exercise 12.5: The electric
> For Exercise 12.8 on page 451, construct a 90% confidence interval for the mean compressive strength when the concentration is x = 19.5 and a quadratic model is used. Exercise 12.8: The following is a set of coded experimental data on the compressive st
> Using the data of Exercise 12.2 on page 450 and the estimate of σ2 from Exercise 12.17, compute 95% confidence intervals for the predicted response and the mean response when x1 = 900 and x2 = 1.00. Exercise 12.2: In Applied Spectroscopy, the
> The mathematics department of a large university is designing a placement test to be given to incoming freshman classes. Members of the department feel that the average grade for this test will vary from one freshman class to another. This variation of t
> For the model of Exercise 12.1 on page 450, test the hypotheses that β1 = 2 against the alternative that β1 = 2. Use a P-value in your conclusion. Exercise 12.1: A set of experimental runs was made to determine a way of predictin
> For the model of Exercise 12.2 on page 450, test the hypothesis that β1 = 0 at the 0.05 level of significance against the alternative that β1 = 0. Exercise 12.2: In Applied Spectroscopy, the infrared reflectance spectra propertie
> For the model of Exercise 12.7 on page 451, 462 Chapter 12 Multiple Linear Regression and Certain Nonlinear Regression Models test the hypothesis that β2 = 0 at the 0.05 level of significance against the alternative that β2 = 0.
> Referring to Exercise 12.5 on page 450, find the estimate of (a) σ2b2 ; (b) Cov(b1, b4). Exercise 12.5: The electric power consumed each month by a chemical plant is thought to be related to the average ambient temperature x1, the number of d
> Obtain estimates of the variances and the covariance of the estimators b1 and b2 of Exercise 12.2 on page 450. Exercise 12.2: In Applied Spectroscopy, the infrared reflectance spectra properties of a viscous liquid used in the electronics industry as a
> In Applied Spectroscopy, the infrared reflectance spectra properties of a viscous liquid used in the electronics industry as a lubricant were studied. The designed experiment consisted of the effect of band frequency x1 and film thickness x2 on optical d
> For the data of Exercise 12.5 on page 450, estimate σ2. Exercise 12.5: The electric power consumed each month by a chemical plant is thought to be related to the average ambient temperature x1, the number of days in the month x2, the average
> For the data of Exercise 12.1 on page 450, estimate σ2. Exercise 12.1: In Applied Spectroscopy, the infrared reflectance spectra properties of a viscous liquid used in the electronics industry as a lubricant were studied. The designed experim
> For the data of Exercise 12.2 on page 450, estimate σ2. Exercise 12.2: In Applied Spectroscopy, the infrared reflectance spectra properties of a viscous liquid used in the electronics industry as a lubricant were studied. The designed experim
> An engineer at a semiconductor company wants to model the relationship between the gain or hFE of a device (y) and three parameters: emitter-RS (x1), base-RS (x2), and emitter-to-base-RS (x3). The data are shown below: (Data from Myers, Montgomery, a
> The daily profit from a juice vending machine placed in an office building is a value of a normal random variable with unknown mean μ and variance σ2. Of course, the mean will vary somewhat from building to building, and the distributor feels that these
> The personnel department of a certain industrial firm used 12 subjects in a study to determine the relationship between job performance rating (y) and scores on four tests. The data are as follows: Properties of the Least Squares Estimators 453 Estima
> Eleven student teachers took part in an evaluation program designed to measure teacher effectiveness and determine what factors are important. The response measure was a quantitative evaluation of the teacher. The regressor variables were scores on four
> A study was performed on a type of bearing to find the relationship of amount of wear y to x1 = oil viscosity and x2 = load. The following data were obtained. (From Response Surface Methodology, Myers, Montgomery, and Anderson-Cook, 2009.) (a) Estimat
> The following data reflect information from 17 U.S. Naval hospitals at various sites around the world. The regressors are workload variables, that is, items that result in the need for personnel in a hospital. A brief description of the variables is as f
> The following data are given: (a) Fit the cubic model μY |x = β0+β1x+β2x2+β3x3. (b) Predict Y when x = 2. 0 1 2 1 4 5 3 4 5 3 2 3 4
> A set of experimental runs was made to determine a way of predicting cooking time y at various values of oven width x1 and flue temperature x2. The coded data were recorded as follows: Estimate the multiple linear regression equation μY
> Case Study: Consider the data set for Exercise 12.12, page 452 (hospital data), repeated here. (c) Comment on what other analyses should be run. (d) Run appropriate analyses and write your conclusions concerning the final model. Site 1 15.57 44.0
> Show that in choosing the so-called best subset model from a series of candidate models, choosing the model with the smallest s2 is equivalent to choosing the model with the smallest R2adj.
> A study was conducted to determine whether lifestyle changes could replace medication in reducing blood pressure among hypertensives. The factors considered were a healthy diet with an exercise program, the typical dosage of medication for hypertension,
> The burn time for the first stage of a rocket is a normal random variable with a standard deviation of 0.8 minute. Assume a normal prior distribution for μ with a mean of 8 minutes and a standard deviation of 0.2 minute. If 10 of these rockets are fired
> A carbon dioxide (CO2) flooding technique is used to extract crude oil. The CO2 floods oil pockets and displaces the crude oil. In an experiment, flow tubes are dipped into sample oil pockets containing a known amount of oil. Using three different values
> Consider the data of Review Exercise 12.64. Suppose it is of interest to add some “interaction” terms. Namely, consider the model yi = β0 + β1x1i + β2x2i + β3x3i + Î
> In exercise physiology, an objective measure of aerobic fitness is the oxygen consumption in volume per unit body weight per unit time. Thirty-one individuals were used in an experiment in order to be able to model oxygen consumption against age in years
> In a chemical engineering experiment dealing with heat transfer in a shallow fluidized bed, data are collected on the following four regressor variables: fluidizing gas flow rate, lb/hr (x1); supernatant gas flow rate, lb/hr (x2); supernatant gas inlet n
> A small experiment was conducted to fit a multiple regression equation relating the yield y to temperature x1, reaction time x2, and concentration of one of the reactants x3. Two levels of each variable were chosen, and measurements corresponding to the
> Show that, in a multiple linear regression data set, hi =p. 2=1
> In the Department of Fisheries and Wildlife at Virginia Tech, an experiment was conducted to study the effect of stream characteristics on fish biomass. The regressor variables are as follows: average depth (of 50 cells), x1; area of in-stream cover (i.e
> In an experiment to ascertain the effect of load, x, in lb/inches2, on the probability of failure of specimens of a certain fabric type, an experiment was conducted in which numbers of specimens were exposed to loads ranging from 5 lb/in.2 to 90 lb/in.2.
> From a set of streptonignic dose-response data, an experimenter desires to develop a relationship between the proportion of lymphoblasts sampled that contain aberrations and the dosage of streptonignic. Five dosage levels were applied to the rabbits used
> The developer of a new condominium complex claims that 3 out of 5 buyers will prefer a two-bedroom unit, while his banker claims that it would be more correct to say that 7 out of 10 buyers will prefer a two bedroom unit. In previous predictions of this
> In Exercise 12.28, page 462, we have the following data concerning wear of a bearing: (a) The following model may be considered to describe the data: yi = β0 + β1x1i + β2x2i + β12x1ix2i + i, for i = 1, 2,
> For Exercise 12.57, test H0: β1 = β6 = 0. Give P-values and comment. Exercise 12.57: The pull strength of a wire bond is an important characteristic. The following data give information on pull strength y, die height x1, post he
> The pull strength of a wire bond is an important characteristic. The following data give information on pull strength y, die height x1, post height x2, loop height x3, wire length x4, bond width on the die x5, and bond width on the post x6. (From Myers,
> In an effort to model executive compensation for the year 1979, 33 firms were selected, and data were gathered on compensation, sales, profits, and employment. The following data were gathered for the year 1979. Consider the model yi = β0
> For the randomized block design with k treatments and b blocks, show that b. E(SSB) = (b – 1)o² + k B3. j=1

