Question: Nike, Inc.’s principal business activity involves
Nike, Inc.’s principal business activity involves the design, development, and worldwide marketing of athletic footwear, apparel, equipment, accessories, and services for serious and recreational athletes. Nike boasts that it is the largest seller of athletic footwear and apparel in the world. Nike sells products to retail accounts, through Nike-owned retail stores and Internet websites, and through a mix of independent distributors and licensees throughout the world. Nearly all of Nike’s footwear and apparel products are produced in Asia (Vietnam, China, and Indonesia) and elsewhere outside of the United States, while equipment products are produced both in the United States and abroad. For more information, visit Nike’s investor relations website page: https://investors.nike.com/Home/default.aspx.17 This case uses Nike’s financial statements and excerpts from its notes to review important concepts underlying the three principal financial statements (balance sheet, income statement, and statement of cash flows) and relations among them. The case also introduces tools for analyzing financial statements. Industry Economics Product Lines Industry analysts debate whether the athletic footwear and apparel industry is a performance-driven industry or a fashion-driven industry. Proponents of the performance view point to Nike’s dominant market position, which results in part from continual innovation in product development. Proponents of the fashion view point to the difficulty of protecting technological improvements from competitor imitation, the large portion of total expenses comprising advertising, the role of sports and other personalities in promoting athletic shoes, and the fact that a high percentage of athletic footwear and apparel consumers use the products for casual wear rather than athletic purposes. Growth There are only modest growth opportunities for footwear and apparel in the United States. Concern exists with respect to volume increases (how many pairs of athletic shoes do consumers want) and price increases (will consumers continue to pay prices for innovative athletic footwear that is often twice as costly as other footwear).
Athletic footwear companies have diversified their revenue sources in two directions in recent years. One direction involves increased emphasis on international sales. With dress codes becoming more casual in Europe and East Asia, industry analysts view international markets as the major growth markets during the next several years. Increased emphasis on soccer (European football) in the United States aids companies such as Adidas that have reputations for quality soccer footwear. The second direction for diversification is sports and athletic apparel. The three leading athletic footwear companies capitalize on their brand-name recognition and distribution channels to create lines of sportswear and equipment that coordinate with their footwear. Team uniforms and matching apparel for coaching staffs and fans have become a major growth avenue.
Marketing Athletic footwear and sportswear companies sell their products to consumers through various independent department, specialty, and discount stores, as well as through online sales channels. Their sales forces educate retailers on new product innovations, store display design, and similar activities. The market shares of Nike and the other major brand-name producers dominate retailers’ shelf space, and slower growth in sales makes it increasingly difficult for the remaining athletic footwear companies to gain market share. The slower growth also has led the major companies to increase significantly their advertising and payments for celebrity endorsements. Many footwear companies, including Nike, have opened their own retail stores, as well as factory outlet stores for discounted sales of excess inventory. Athletic footwear and sportswear companies have typically used independent distributors to market their products in other countries. With increasing brand recognition and anticipated growth in international sales, these companies have recently acquired an increasing number of their distributors LO 1-3, LO 1-4 17While information on the investor relations page may be helpful, it is not necessary to complete this case. Nike: Somewhere between a Swoosh and a Slam Dunk 59 Copyright 2023 Cengage Learning. All Rights Reserved. May not be copied, scanned, or duplicated, in whole or in part. Due to electronic rights, some third-party content may be suppressed from the eBook and/or eChapter(s). Editorial review has deemed that any suppressed content does not materially affect the overall learning experience. Cengage Learning reserves the right to remove additional content at any time if subsequent rights restrictions require it. to capture more of the profits generated in other countries and maintain better control of international marketing. Nike Strategy Nike targets the serious athlete as well as the recreational athlete with performance-driven footwear, apparel, and equipment. The firm has steadily expanded the scope of its product portfolio from its primary products of high-quality athletic footwear for running, training, basketball, soccer, and casual wear to encompass related product lines such as sports apparel, bags, equipment, balls, eyewear, timepieces, and other athletic accessories. In addition, Nike has expanded its scope of sports, now offering products for swimming, baseball, cheerleading, football, golf, lacrosse, tennis, volleyball, skateboarding, and other leisure activities. In recent years, the firm has emphasized growth outside the United States. Nike also has grown by acquiring other apparel companies, including Cole Haan (dress and casual footwear), Converse (athletic and casual footwear and apparel), Hurley (apparel for action sports such as surfing, skateboarding, and snowboarding), and Umbro (footwear, apparel, and equipment for soccer). To maintain its technological edge, Nike engages in extensive research at its research facilities in Beaverton, Oregon. It continually alters its product line to introduce new footwear, apparel, equipment, and evolutionary improvements in existing products. The following exhibits present information for Nike:
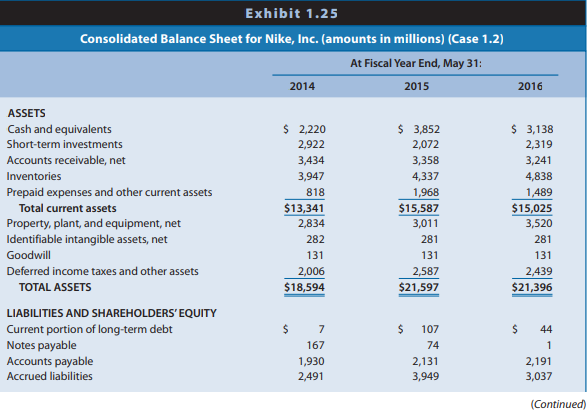
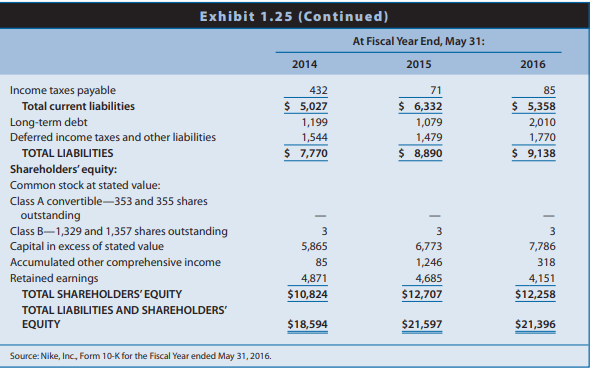
Exhibit 1.24: Consolidated balance sheets for 2014, 2015, and 2016
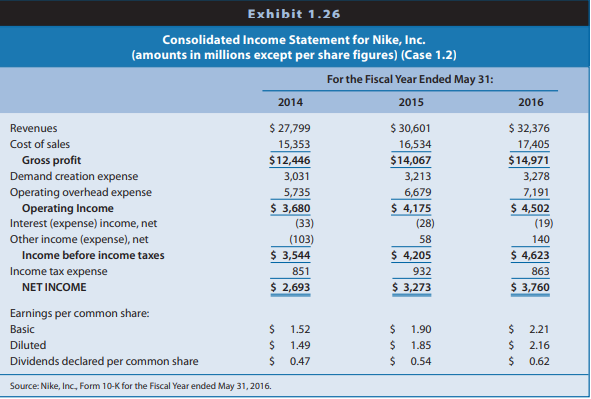
Exhibit 1.25: Consolidated income statements for 2014, 2015, and 2016
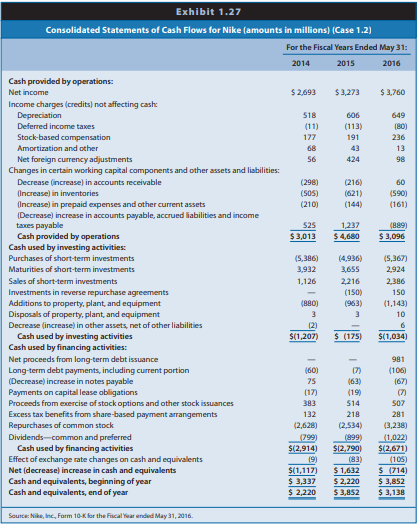
Exhibit 1.26: Consolidated statements of cash flows for 2014, 2015, and 2016
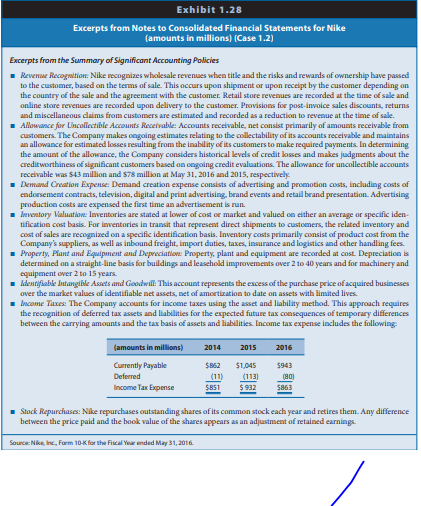
Exhibit 1.27: Excerpts from the notes to Nike’s financial statements
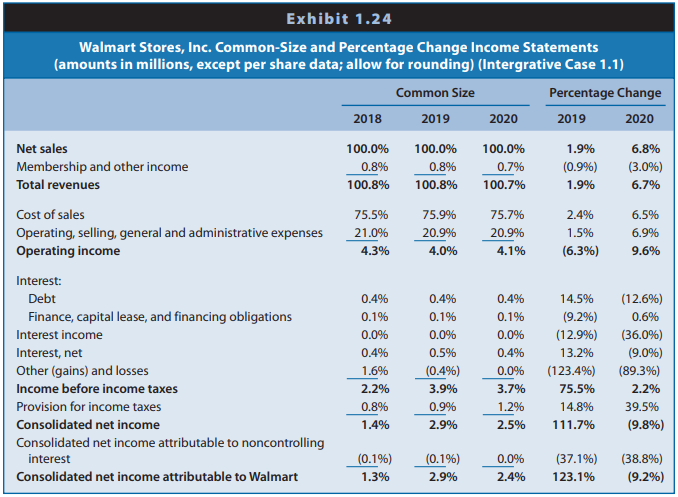
Exhibit 1.28: Common-size and percentage change income statements
Exhibit 1.29: Common-size and percentage change balance sheets
REQUIRED
Study the financial statements and notes for Nike and respond to the following questions. Income Statement
a. Identify when Nike recognizes revenues. Does this timing of revenue recognition seem appropriate? Explain.
b. Identify the cost-flow assumption(s) that Nike uses to measure cost of goods sold. Does Nike’s choice of cost-flow assumption(s) seem appropriate? Explain.
c. Nike reports property, plant, and equipment on its balance sheet and discloses the amount of
depreciation for each year in its statement of cash flows. Why doesn’t depreciation expense appear among its expenses on the income statement?
d. What does “demand creation expense†represent?
e. Identify the portion of Nike’s income tax expense of $863 million for 2016 that is currently payable to governmental entities and the portion that is deferred to future years. Why is the amount currently payable to governmental entities in 2016 greater than the income tax expense?
Balance Sheet
f. Why do accounts receivable (net) appear net of allowance for doubtful accounts? Identify the events or transactions that cause the allowance account to increase or decrease.
g. What is the largest asset (in dollar amount) on Nike’s balance sheet? How does this asset relate to Nike’s strategy?
h. Identify the depreciation method(s) that Nike uses for its buildings and equipment. Does Nike’s
choice of depreciation method(s) seem appropriate?
i. Nike includes identifiable intangible assets on its balance sheet. Does this account include the value of Nike’s brand name and Nike’s “swoosh†trademark? Explain.
Statement of Cash Flows
j. Why does the amount of net income differ from the amount of cash flow from operations?
k. Why does Nike add depreciation expense back to net income when calculating cash flow from operations?
l. Why does Nike subtract increases in accounts receivable from net income when calculating cash flow from operations for 2016?
m. Why does Nike adjust net income by subtracting increases in inventory and adding decreases in inventory when calculating cash flow from operations?
n. When calculating cash flow from operations, why does Nike adjust net income by adding increases and subtracting decreases in accounts payable?
o. Cash flow from operations exceeded net income during fiscal 2015, but not during fiscal 2016. Why? What caused the big drop in cash flows provided by operations from 2015 to 2016?
p. What were Nike’s primary financing activities during these three years?
Common-Size Percentage Change
Relations between Financial Statement Items
q. Compute the amount of cash collected from customers during 2016.
r. Compute the amount of cash payments made to suppliers of merchandise during 2016.
s. Reconcile the change in retained earnings during 2016. Interpreting Financial Statement Relations
t. Exhibit 1.29 presents common-size and percentage change income statements for Nike for 2014,
2015, and 2016. What are some reasons for the increases in the net income/sales revenue percentages for Nike between 2014 and 2015, and between 2015 and 2016?
u. Exhibit 1.30 presents common-size and percentage change balance sheets for Nike at the end of 2014, 2015, and 2016. What is the likely explanation for the relatively small percentages for property, plant, and equipment?
v. What is the likely explanation for the relatively small percentages for notes payable and long-term debt?
> The Coca-Cola Company is a global soft-drink beverage company. The data in Chapter 12, Exhibits 12.14 through 12.16, include the actual amounts for 2020 and projected amounts for Year 11 to Year 16 for the income statements, balance sheets, and statement
> The Coca-Cola Company is a global soft drink beverage company (ticker: KO). The data in Chapter 12’s Exhibits 12.14, 12.15, and 12.16 (pages 712–715) include the actual amounts for 2020 and projected amounts for Year 11 to Year 16 for the income statemen
> Suppose the following hypothetical data represent total assets, book value, and market value of common shareholders’ equity (dollar amounts in millions) for Microsoft, Intel, and Dell, three firms involved in different aspects of the co
> The Coca-Cola Company is a global soft drink beverage company (ticker symbol = KO). The data in Exhibits 12.14 to 12.16 include the actual amounts for fiscal 2020 and projected amounts for Year +1 to Year +6 for the income statements, balance sheets, and
> The 3M Company is a global diversified technology company active in the following product markets: consumer and office; display and graphics; electronics and communications; health care; industrial; safety, security, and protection services; and transpor
> Walmart Stores (Walmart) is the world’s largest retailer. It employs an “everyday low price” strategy and operates stores as three business segments: Walmart U.S., International, and Samâ€&
> The Coca-Cola Company is a global soft drink beverage company (ticker: KO). The following data for Coca-Cola include the actual amounts for Year 0 and the projected amounts for Years 11 through 15 for comprehensive income and common shareholdersâ&#
> Barnes & Noble sells books, magazines, music, and videos through retail stores and online. For a retailer like Barnes & Noble, inventory is a critical element of the business, and it is necessary to carry a wide array of titles. Inventories constitute th
> Hasbro designs, manufactures, and markets toys and games for children and adults in the United States and in international markets. Hasbro’s portfolio of brands and products contains some of the most well-known toys and games under famous brands such as
> The following is an excerpt from Note 13 (Pensions and Other Post-Employment Benefits) to the 2020 Consolidated Financial Statements of Coca-Cola Company (Coca-Cola): REQUIRED: a. Write a memorandum explaining the change in the net pension liability in
> The following are excerpts from Note 14 (Income Taxes) to the 2020 Consolidated Financial Statements of Coca-Cola Company (Coca-Cola): A reconciliation of the statutory U.S. federal tax rate and our effective tax rate is as follows: REQUIRED: a. Does Co
> Kentucky Gold (KG) holds 10,000 gallons of whis key in inventory on October 31, Year 1, that costs $225 per gallon. KG contemplates selling the whiskey on March 31, Year 2, when it completes the aging process. Uncertainty about the selling price of whisk
> Lynn Construction enters into a firm purchase commitment for equipment to be delivered on June 30, Year 1, for a price of £10,000. It simultaneously signs a forward foreign exchange contract for £10,000. The forward rate on June 30, Year 1, for settlemen
> Following information relates to a firm’s pension plan. REQUIRED: a. Compute the December 31, Year 1, PBO and FMV of pension assets. b. Compute Year 1 pension expense. c. Use the financial statements effects template to show the eff
> A large manufacturer of truck and car tires recently changed its cost-flow assumption method for inventories at the beginning of Year 2. The manufacturer has been in operation for almost 40 years, and for the last decade it has reported moderate growth i
> Deere & Company manufactures agricultural and industrial equipment and provides financing services for its independent dealers and their retail customers. In Note 2 to its October 31, Year 12, Form 10-K, Deere discloses the following revenue recognition
> Prime Contractors (Prime) is a privately owned company that contracts with the U.S. government to provide various services under multiyear (usually five-year) contracts. Its principal services are as follows: Refuse: Picks up and disposes of refuse from
> On January 1, Year 1, assume that Turner Construction Company agreed to construct an observatory for Dartmouth College for $120 million. Dartmouth College must pay $60 million upon signing and $30 million in Year 2 and Year 3. Expected construction costs
> Foreign Sub is a wholly owned subsidiary of U.S. Domestic Corporation. U.S. Domestic Corporation acquired the subsidiary several years ago. The financial statements for Foreign Sub for Year 2 in its own currency appear in Exhibit 8.31. LO 8-6 December 31
> Exhibit 8.28 presents the separate financial statements at December 31, Year 2, of Prestige Resorts and its 80%-owned subsidiary Booking, Inc. Two years earlier on January 1, Year 1, Prestige acquired 80% of the common shares of B
> On December 31, Year 1, Pace Co. paid $3,000,000 to Sanders Corp. shareholders to acquire 100% of the net assets of Sanders Corp. Pace Co. also agreed to pay former Sanders shareholders $200,000 in cash if certain earnings projections were achieved over
> Ormond Co. acquired all of the outstanding common stock of Daytona Co. on January 1, Year 1. Ormond Co. gave shares of its common stock with a fair value of $312 million in exchange for 100% of the Daytona Co. common stock. Daytona Co. will remain a lega
> Lexington Corporation acquired all of the outstanding common stock of Chalfont, Inc., on January 1, Year 1. Lexington gave shares of its no par common stock with a market value of $504 million in exchange for the Chalfont common stock. Chalfont will rema
> Bed and Breakfast (B&B), an Italian company operating in the Tuscany region, follows IFRS and has made the choice to premeasure long-lived assets at fair value. B&B purchased land in Year 1 for €150,000. At December 31 of the next four years, the land is
> Floral Delivery, Inc. (FD) acquired a fleet of vans on January 1, 2021, by issuing a $500,000, four-year, 4% fixed rate note, with interest payable annually on December 3. FD has the option to repay the note prior to maturity at the note’s fair value. FD
> Exhibits 7.14 and 7.15 provide footnote excerpts to the financial reports of The Coca-Cola Company and Eli Lilly and Company that discuss the stock option grants given to the employees of the two firms. Each firm uses options extensively to reward employ
> Eli Lilly and Company Produces pharmaceutical products for humans and animals. Exhibit 7.15 includes a footnote excerpt from the annual report of Lilly for the period ending December 31, Year 4. REQUIRED: Review Exhibits 7.15 and answer the following qu
> Refer to financial statements for Walmart in Exhibit 1.19 (Balance Sheets), Exhibit 1.20 (Statements of Income), and Exhibit 1.22 (Statement of Cash Flows). Exhibit 1.19: Exhibit 1.20: Exhibit 1.22: REQUIRED a. Explain why depreciation and amortiza
> Exhibit 7.14 includes a footnote excerpt from the annual report of The Coca-Cola Company for Year 4. The beverage company offers stock options to key employees under plans approved by stockholders. REQUIRED: Review Exhibit 7.14 and answer the followin
> On January 1 of Year 1, Baylor Company needs to acquire an industrial drilling machine that has a five-year life. Baylor could borrow funds and buy the machine outright for $50,000 or it could lease it from Gonzaga Financial by making annual end-of-the-y
> Exhibits 6.17–6.19 present the December 31, 2019, Consolidated Statements of Income, Statements of Comprehensive Income, Consolidated Statements of Cash Flows for Chipotle Mexican Grill, Inc. Notes 5 and 6 to the financial statements pr
> Socket Mobile develops and deploys bar-code-enabled mobile apps, cordless bar-code scanners, and contactless reading and writing devices to enable data capture. Its primary revenue source is the servicing of firms in the specialty retailer, field service
> Exhibit 6.16 presents the Consolidated Statements for Income of Harley-Davidson, Inc., and Note 3 describes restructuring expenses. NOTE: 3 Accompanying HARLEY-DAVIDSON, INC. December 31, 2019, Consolidated Financial Statements 3. Restructuring Expense
> Diviney Company wants to raise $50 million cash but for various reasons does not want to do so in a way that results in a newly recorded liability. The firm is sufficiently solvent and profitable, so its bank is willing to lend up to $50 million at the p
> Delta Air Lines, Inc., is one of the largest airlines in the United States. It has operated on the verge of bankruptcy for several years. Exhibit 5.17 presents selected financial data for Delta Air Lines for each of the five years ending December 31, 200
> Exhibit 5.16 presents risk ratios for Coca-Cola for Year 1 through Year 3. REQUIRED a. Assess the changes in the short-term liquidity risk of Coca-Cola between Year 1 and Year 3. b. Assess the changes in the long-term solvency risk of Coca-Cola betwe
> Abercrombie & Fitch sells casual apparel and personal care products for men, women, and children through retail stores located primarily in shopping malls. Its fiscal year ends January 31 of each year. Financial statements for Abercrombie & Fitch
> The following are summary financial data for three well-known companies—American Airlines, Amazon, and The Home Depot. Based on your awareness of these companies and the economic events surrounding the COVID-19 pandemic that
> Exhibits 1.19–1.22 of Integrative Case 1.1 (Chapter 1) present the financial statements for Walmart for 2019–2021. In addition, the website for this text contains Walmart’s January 31, 2021, Form 10-K
> Analyzing the profitability of restaurants requires consideration of their strategies with respect to ownership of restaurants versus franchising. Firms that own and operate their restaurants report the assets and financing of those restaurants on their
> Selected data for General Mills for Year 1, Year 2, and Year 3 appear below (amounts in millions). REQUIRED a. Compute the rate of ROCE for Year 1, Year 2, and Year 3. b. Compute basic EPS for Year 1, Year 2, and Year 3. c. Interpret the changes in RO
> Sirius XM Radio Inc. is a satellite radio company, formed from the merger of Sirius and XM in 2008. Exhibit 3.20 presents a statement of cash flows for Sirius XM Radio for 2006, 2007, and 2008. Sirius XM and its predecessor, Sirius, realized revenue grow
> Aer Lingus is an international airline based in Ireland. Exhibit 3.24 provides the statement of cash flows for Year 1 and Year 2, which includes a footnote from the financial statements. Year 2 was characterized by weakening consumer demand for air trave
> The Apollo Group is one of the largest providers of private education and runs numerous programs and services, including the University of Phoenix. Exhibit 3.23 provides statements of cash flows for Year 1 through Year 3. REQUIRED Discuss the relation
> Montgomery Ward operates a retail department store chain. It filed for bankruptcy during the first quarter of Year 12. Exhibit 3.22 presents a statement of cash flows for Montgomery Ward for Year 7 to Year 11. The firm acquired Lechmere, a discount reta
> Sunbeam Corporation manufactures and sells a variety of small household appliances, including toasters, food processors, and waffle grills. Exhibit 3.21 presents a statement of cash flows for Sunbeam for Year 5, Year 6, and Year 7. After experiencing de
> Using the analytical framework, indicate the effect of each of the three independent sets of transactions described next. (1) a. January 15, 2018: Purchased marketable debt securities for $100,000. b. December 31, 2018: Revalued the marketable securiti
> In Integrative Case 10.1, we projected financial statements for Walmart Stores for Years 11 through 15. The data in Chapter 12, Exhibits 12.17 through 12.19, include the actual amounts for 2020 and the projected amounts for Year 11 to Year 16 for the inc
> Residual Income Valuation of Walmart’s Common Equity In Integrative Case 10.1, we projected financial statements for Walmart Stores, Inc. (Walmart), for Years 11 through 15. The data in Chapter 12’s Exhibits 12.17, 12.
> Holmes Corporation is a leading designer and manufacturer of material handling and processing equipment for heavy industry in the United States and abroad. Its sales have more than doubled, and its earnings have increased more than sixfold in the past fi
> In Integrative Case 10.1, we projected financial statements for Walmart Stores, Inc. (Walmart), for Years +1 through +5. In this portion of the Walmart Integrative Case, we use the projected financial statements from Integrative Case 10.1 and apply the t
> Integrative Case 10.1 involves projecting financial statements for Walmart for Years 11 through 15. The following data for Walmart include the actual amounts for fiscal 2020 and the projected amounts for Years 11 through 15 for comprehensive income and c
> Since the early 1990s, woodstove sales have declined from 1,200,000 units per year to approximately 100,000 units per year. The decline has occurred because of (1) stringent new federal EPA regulations, which set maximum limits on stove emissions beginni
> Walmart Stores, Inc. (Walmart) is the largest retailing firm in the world. Building on a base of discount stores, Walmart has expanded into warehouse clubs and Supercenters, which sell traditional discount store items and grocery products. Exhibits 10.10
> The website for this text contains Walmart’s January 31, 2021, Form 10-K. You should read the management discussion and analysis (MD&A), financial statements, and notes to the financial statements, especially Note 1, “Summary of Significant Accounting Po
> Walmart makes significant investments in operating capacity, primarily via investments in property, plant, and equipment, but also via investments in wholly and partially owned subsidiaries. Walmart also has significant non-U.S. operations in its Walmart
> As you learned in the first two steps of the six-step financial statement analysis and valuation process, a firm’s financing activity is greatly influenced by industry economics and strategy, especially its stage within its life cycle. Early-stage firms
> Arbortech, a designer, manufacturer, and marketer of PC cards for computers, printers, telecommunications equipment, and equipment diagnostic systems, was the darling of Wall Street during Year 6. Its common stock price was the leading gainer for the yea
> Citigroup Inc. (Citi) is a leading global financial services company with more than 200 million customer accounts and operations in more than 140 countries. Its operating units Citicorp and Citi Holdings provide a broad range of financial products and se
> The first case at the end of this chapter and numerous subsequent chapters is a series of integrative cases involving Walmart, Inc. (Walmart). The series of cases applies the concepts and analytical tools discussed in each chapter to Walmartâ€
> Diamond Bank expects that the Singapore dollar will depreciate against the U.S. dollar from its spot rate of $0.43 to $0.42 in 60 days. The following interbank lending and borrowing rates exist: Diamond Bank considers borrowing 10 million Singapore doll
> Blue Demon Bank expects that the Mexican peso will depreciate against the dollar from its spot rate of $0.15 to $0.14 in 10 days. The following interbank lending and borrowing rates exist: Assume that Blue Demon Bank has a borrowing capacity of either $
> Assume that the U.S. inflation rate becomes high relative to Canadian inflation. Other things being equal, how should this affect (a) the U.S. demand for Canadian dollars, (b) the supply of Canadian dollars for sale, and (c) the equilibrium value of t
> Assume that the United States invests heavily in government and corporate securities of Country K. In addition, residents of Country K invest heavily in the United States. Approximately $10 billion worth of investment transactions occur between these two
> Mexico tends to have much higher inflation than the United States as well as much higher interest rates than the United States. Inflation and interest rates are much more volatile in Mexico than in industrialized countries. The value of the Mexican peso
> Tarheel Co. plans to determine how changes in U.S. and Mexican real interest rates will affect the value of the U.S. dollar. (See Appendix C for the basics of regression analysis.) a. Describe a regression model that could be used to achieve this purpos
> How do you think weaker U.S. economic conditions could affect capital flows? If capital flows are affected, how would this influence the value of the dollar (holding other factors constant)?
> Why do you think most crises in countries cause the local currency to weaken abruptly? Is it because of trade flows or capital flows
> If Asian countries experience a decline in economic growth (and experience a decline in inflation and interest rates as a result), how will their currency values (relative to the U.S. dollar) be affected?
> Analysts commonly attribute the appreciation of a currency to expectations that economic conditions will strengthen. Yet, this chapter suggests that when other factors are held constant, increased national income could increase imports and cause the loca
> On August 26, 1998, the day that Russia decided to let the ruble float freely, the ruble declined by about 50 percent. N the following day, called bloody Thursday, stock markets around the world (including the U.S.) declined by more than 4 percent. Why d
> In some historical periods, Brazil’s inflation rate has been very high. Explain why this places pressure on the Brazilian currency
> Explain why the value of the British pound against the dollar will not always move in tandem with the value of the euro against the dollar.
> Every month, the U.S. trade deficit figures are announced. Foreign exchange traders often react to this announcement and even attempt to forecast the figures before they are announced. a. Why do you think the trade deficit announcement sometimes has suc
> Assume the spot rate of the British pound is $1.73. The expected spot rate one year from now is assumed to be $1.66. What percentage depreciation does this reflect?
> Explain the foreign exchange situation for countries that use the euro when they engage in international trade among themselves.
> The Wolfpack Corp. is a U.S. exporter that invoices its exports to the United Kingdom in British pounds. If it expects that the pound will appreciate against the dollar in the future, should it hedge its exports with a forward contract? Explain.
> Compute the bid/ask percentage spread for Mexican peso retail transactions in which the ask rate is $0.11 and the bid rate is $0.10.
> Utah Bank’s bid price for Canadian dollars is $0.7938 and its ask price is $0.8100. What is the bid/ask percentage spread?
> List some of the important characteristics of bank foreign exchange services that MNCs should consider.
> Explain how the appreciation of the Japanese yen against the U.S. dollar would affect the return to a U.S. firm that borrowed Japanese yen and used the proceeds for a U.S. project.
> During the Hong Kong crisis, the Hong Kong stock market declined substantially over a four-day period due to concerns in the foreign exchange market. Why would stock prices decline due to such concerns in the foreign exchange market? Why would some count
> In July 2015, Greece was negotiating to obtain its third bailout from several European governments over a five-year period. Greece argued that austerity measures should not be imposed. Offer some reasoning for this argument. The European governments insi
> As of today, the interest rates in Countries X, Y, and Z are similar. In the next month, Country X is expected to have a weak economy, while Countries Y and Z are expected to experience a 6 percent increase in their economic growth. However, conditions t
> Bloomington Co. is a large U.S.-based MNC with large subsidiaries in Germany. It has issued stock in Germany to establish its business. As an alternative financing mechanism, it could have issued stock in the United States and then used the proceeds to s
> Explain how the international integration of financial markets caused the credit crisis of 2008–2009 to spread across many countries
> Explain how the appreciation of the Australian dollar against the U.S. dollar would affect the return to a U.S. firm that invested in an Australian money market security.
> Identify some of the key factors that can allow for stronger governance, thereby increasing participation and trading activity in a stock market
> a. What factors cause some firms to become more internationalized than others? b. Why might the Internet have resulted in more international business?
> a. Do you think the acquisition of a foreign firm or licensing will result in greater growth for an MNC? Which alternative is likely to have more risk? b. Describe a scenario in which the size of a corporation is not affected by access to international
> a. Explain how the existence of imperfect markets has led to the establishment of subsidiaries in foreign markets. b. If perfect markets existed, would wages, prices, and interest rates among countries be more similar or less similar than under conditio
> a. Explain how the theory of comparative advantage relates to the need for international business. b. Explain how the product cycle theory relates to the growth of an MNC.
> Explain the relationship between transparency of firms and investor participation (or trading activity) in stock markets. Based on this relationship, how can governments of countries increase the amount of trading activity (and therefore liquidity) of th
> a. Explain the agency problem of MNCs. b. Why might agency costs be larger for an MNC than for a purely domestic firm?
> Briefly describe the historical developments that led to floating exchange rates as of 1973.
> What is the function of the international money markets? Briefly describe the reasons for the development and growth of the European money market. Explain how the international money, credit, and bond markets differ from one another.
> Explain the process used by banks in the Eurocredit market to determine the rate to charge on loans.
> Explain how syndicated loans are used in international markets
> Assume Poland’s currency (the zloty) is worth $0.17 and the Japanese yen is worth $0.008. What is the cross exchange rate of the zloty with respect to yen? That is, how many yen equal one zloty?
> If the direct exchange rate of the euro is $1.25, what is the euro’s indirect exchange rate? That is, what is the value of a dollar in euros?

