Question: Refer to Exercise 8-21 and the
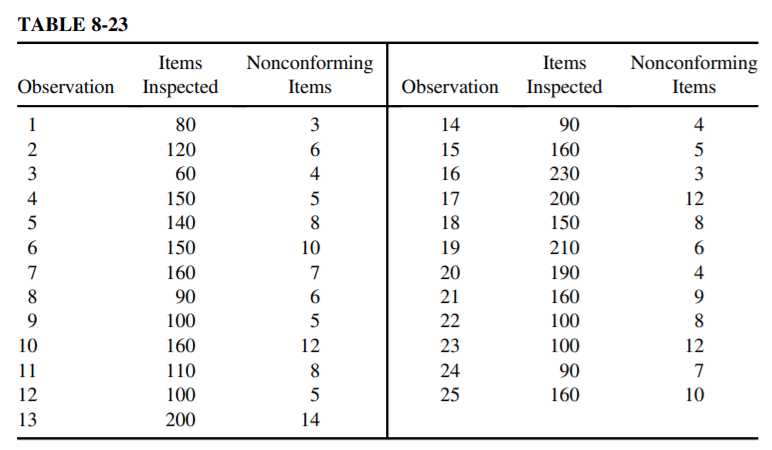
Refer to Exercise 8-21 and the data shown in Table 8-23. Construct a standardized p-chart and discuss your conclusions.
Data from Exercise 8-21:
Observations are taken from the output of a company making semiconductors. Table 8-23 shows the sample size and the number of nonconforming semiconductors for each sample. Construct a p-chart by setting up the exact control limits for each sample. Are any samples out of control? If so, assuming special causes, revise the center line and control limits.
Answer:
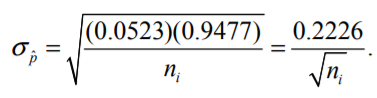
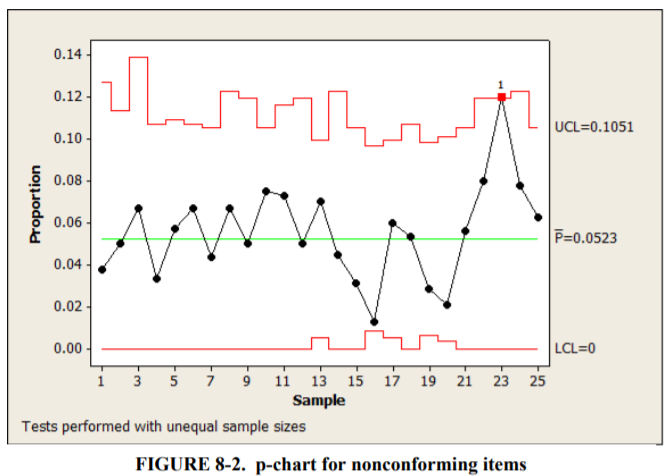
The process average was calculated as p = 0.0523. The standard deviation of the sample fraction nonconforming for the ith sample is given by:
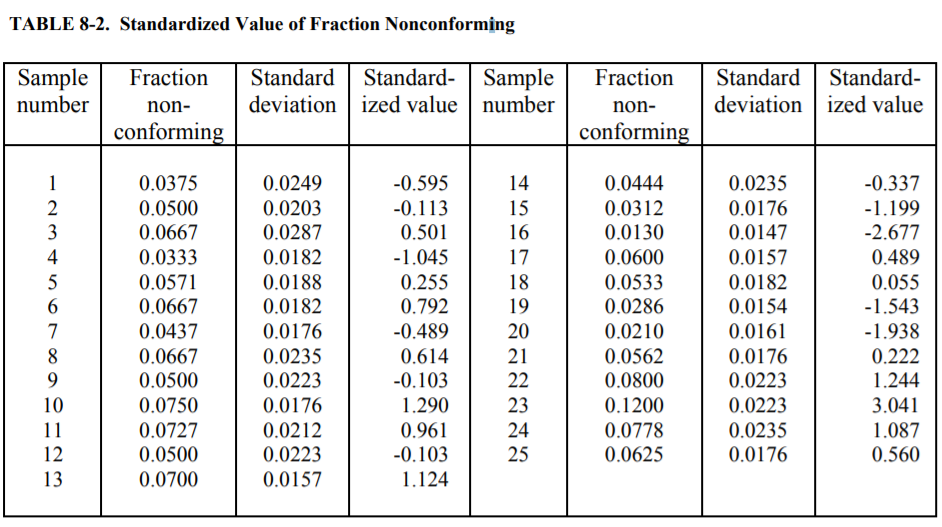
The standardized values are shown in Table 8-2. Since the control limits are at 3 and -3, sample number 23 with a standardized value of 3.041 is above the UCL and out of control. The same conclusions, as drawn previously in Problem 8-21, are drawn here.
> In a laboratory you measure the decay rate of a sample of radioactive carbon. You write down the following measurements: (a) Plot the decay rate versus time. (b) Plot the natural logarithm of the decay rate versus the time. Explain why the presentation o
> A graph of x versus t4, with x on the vertical axis and t4 on the horizontal axis, is linear. Its slope is 25 m/s4 and its vertical axis intercept is 3 m. Write an equation for x as a function of t.
> You have just performed an experiment in which you measured many values of two quantities, A and B. According to theory, A = cB3 + A0. You want to verify that the values of c and A0 are correct by making a graph of your data that enables you to determine
> An object is moving in the x-direction. A graph of its position (i.e., its x-coordinate) as a function of time is shown. (a) What are the slope and vertical axis intercept? (Be sure to include units.) (b) What physical significance do the slope and int
> A nurse recorded the values shown in the following chart for a patient's temperature. Plot a graph of temperature versus elapsed time. From the graph, find (a) an estimate of the temperature at noon and (b) the slope of the graph. (c) Would you expect
> A patient's temperature was 97.0°F at 8:05 A.M. and 101.0°F at 12:05 P.M. If the temperature changes with respect to elapsed time was linear throughout the day, what would the patient's temperature be at 3:35 P.M.?
> Average-sized cells in the human body are about 10 µm in diameter. How many cells are in the human body? Make an order-of magnitude estimate.
> The quantity of energy Q transferred by heat conduction through an insulating pad in time interval Δt is described by Q/Δt = κA ΔT/d, where κ is the thermal conductivity of the material, A is the face area of the pad (perpendicular to the direction of he
> What is the order of magnitude of the height (in meters) of a 40-story building?
> Estimate the average number of times a human heart beats during its lifetime.
> Estimate the average mass of a person's leg.
> Estimate the volume of a soccer ball in cubic centimeters (cm3).
> What is the approximate distance from your eyes to a book you are reading?
> An object moving at constant speed v around a circle of radius r has an acceleration a directed toward the center of the circle. The SI unit of acceleration is m/s2. (a) Use dimensional analysis to find how a depends on v and r (i.e., find n and m so th
> An expression for buoyant force is FB = ρgV, where FB has dimensions [MLT−2], ρ (density) has dimensions [ML−3], and g (gravitational field strength) has dimensions [LT−2]. (a) What must be the dimensions of V? (b) Which could be the correct interpretat
> One equation involving force states that Fnet = ma, where Fnet is in newtons (N), m is in kg, and a is in m·s−2. Another equation states that F = −kx, where F is in newtons, k is in kg·s−2, and x is in m. (a) Analyze the dimensions of ma and kx to show t
> An equation for potential energy states U = mgy. If U is in joules (J), with m in kg, y in m, and g in m/s2, find the combination of SI base units that is equivalent to joules.
> An average-sized capillary in the human body has a cross-sectional area of about 150 µm2. What is this area in square millimeters (mm2)?
> The quantity of energy Q transferred by heat conduction through an insulating pad in time interval Δt is described by Q/Δt = κA ΔT/d, where κ is the thermal conductivity of the material, A is the face area of the pad (perpendicular to the direction of he
> A snail crawls at a pace of 5.0 cm/min. Express the snail's speed in (a) ft./s and (b) mi/h.
> (a) How many square centimeters are in 1 square foot? (1 in = 2.54 cm.) (b) How many square centimeters are in 1 square meter?
> Express this product in units of km3 with the appropriate number of significant figures:
> A molecule in air is moving at a speed of 459 m/s. How far would the molecule move during 7.00 ms (milliseconds) if it didn't collide with any other molecules?
> Blood flows through the aorta at an average speed of v = 18 cm/s. The aorta is roughly cylindrical with a radius r = 12 mm. The volume rate of blood flow through the aorta is π r2v. Calculate the volume rate of blood flow through the aorta in L/min.
> The intensity of the Sun's radiation that reaches Earth's atmosphere is 1.4 kW/m2 (kW = kilowatt; W = watt). Convert this to W/cm2.
> At the end of 2006 an expert economist predicted a drop in the value of the U.S. dollar against the euro of 10% over the next five years. If the exchange rate was $1.27 to 1 euro on November 5, 2006, and was $1.45 to 1 euro on November 5, 2007, what was
> The first modern Olympics in 1896 had a marathon distance of 40 km. In 1908, for the Olympic marathon in London, the length was changed to 42.195 km to provide the British royal family with a better view of the race. This distance was adopted as the offi
> A nerve impulse travels along a myelinated neuron at 80 m/s. What is this speed in (a) mi/h and (b) cm/ms?
> A beaker contains 255 mL of water. What is the volume of the water in (a) cubic centimeters? (b) cubic meters?
> The quantity of energy Q transferred by heat conduction through an insulating pad in time interval Δt is described by Q/Δt = κA ΔT/d, where κ is the thermal conductivity of the material, A is the face area of the pad (perpendicular to the direction of he
> The length of the river span of the Brooklyn Bridge is 1595.5 ft. The total length of the bridge is 6016 ft. Convert both of these lengths to meters.
> The label on a small soda bottle lists the volume of the drink as 355 mL. Use the conversion factor 1 gal = 128 fl oz. (a) How many fluid ounces are in the bottle? (b) A competitor's drink is labeled 16.0 fl oz. How many milliliters are in that drink?
> A cell membrane is 7.0 nm thick. How thick is it in inches?
> The density of body fat is 0.9 g/cm3. Find the density in kg/m3.
> Solve the following problem and express the answer in meters per second (m/s) with the appropriate number of significant figures: (3.21 m)/ (7.00 ms) =? Hint: Note that ms stands for milliseconds.
> Solve the following problem and express the answer in meters with the appropriate number of significant figures and in scientific notation:
> Given these measurements, identify the number of significant figures and rewrite in standard scientific notation. (a) 0.005 74 kg (b) 2 m (c) 0.450 × 10⁻² m (d) 45.0 kg (e) 10.09 × 10⁴ s (f) 0.095 00 × 105 mL
> Rank these measurements in order of the number of significant figures, from least to greatest. (a) 7.68 g (b) 0.420 kg (c) 0.073 m (d) 7.68 × 10⁵ g (e) 4.20 × 10³ kg (f) 7.3 × 10⁻² m (g) 2.300 × 10⁴ s
> Find the product below and express the answer with units and in scientific notation with the appropriate number of significant figures:
> On Monday, a stock market index goes up 5.00%. On Tuesday, the index goes down 5.00%. What is the net percentage change in the index for the two days? Explain why it is not zero.
> A study finds that the metabolic rate of mammals is proportional to m3/4, where m is total body mass. By what factor does the metabolic rate of a 70 kg human exceed that of a 5.0 kg cat?
> Samantha is 1.50 m tall on her eleventh birthday and 1.65 m tall on her twelfth birthday. By what factor has her height increased? By what percentage?
> A homeowner is told that she must increase the height of her fences 37% if she wants to keep the deer from jumping in to eat the foliage and blossoms. If the current fence is 1.8 m high, how high must the new fence be?
> 55 mi/h is approximately (a) 90 km/h (b) 30 km/h (c) 10 km/h (d) 2 km/h
> By what factor does the volume of a cube increase if the length of the edges is doubled? (a) 16 (b) 8 (c) 4 (d) 2
> One kilometer is approximately (a) 2 miles (b) 1/2 mile (c) 1/10 mile (d) 1/4 mile
> How many significant figures should be written in the product 0.007840 6 m × 9.450 20 m? (a) 3 (b) 4 (c) 5 (d) 6 (e) 7
> Rank the results of the following calculations in order of the number of significant figures, from least to greatest. (a) 6.85 × 10⁻⁵ m + 2.7 × 10⁻⁷ m (b) 702.35 km + 1897.648 km (c) 5.0 m × 4.302 m (d) (0.040/π) m
> The “scale” of a certain map is 1/10 000. This means the length of, say, a road as represented on the map is 1/10 000 the actual length of the road. What is the ratio of the area of a park as represented on the map to the actual area of the park?
> A computer monitor manufacturer subcontracts its major parts to four vendors: A, B, C, and D. Past records show that vendors A and C provide 30% of the requirements each, vendor B provides 25%, and vendor D provides 15%. In a random sample of 10 parts, 4
> Distinguish between producer’s risk and consumer’s risk. In this context, explain the terms acceptable quality level and limiting quality level. Discuss instances for which one type of risk might be more important than the other.
> Explain the difference between the decision-making procedure using Forms 1 and 2 for variable sampling plans that are designed to estimate the proportion of nonconforming items.
> What are the parameters of a variable sampling plan for which the process average quality is of interest? Explain the working procedure of such a plan when single and double specification limits are given.
> What are the advantages and disadvantages of variable sampling plans over those for attributes?
> Discuss the assumptions made in Deming’s kp rule. When would you use this rule?
> Compare and contrast chain sampling and sequential sampling plans. When are they used?
> Discuss the advantages and disadvantages of sampling.
> Suppose that the dimension of an assembly has to be within certain tolerances. Discuss how tolerances could be set for the components given that the difference between two component dimensions comprises this assembly dimension. Assume that the inherent v
> Suppose that the time to complete a project is the sum of several independent operations. If the means and standard deviations of the independent operations are known, determine the mean and standard deviation of the project completion time. If the opera
> What condition must exist prior to calculating the process capability? Discuss how process capability can be estimated through control charts.
> Discuss the indices for measuring quality costs. Give examples where each might be used.
> Compare the capability indices Cpk, Cpm, and Cpmk and discuss what they measure in the process. When would you use Cpq?
> What are the advantages of having a process spread that is less than the specification spread? What should the value of Cp be in this situation? Could Cpk be here?
> Is it possible for a process to be in control and still produce nonconforming output? Explain. What are some corrective measures under these circumstances?
> What are statistical tolerance limits? Explain how they differ from natural tolerance limits.
> Explain the difference between natural tolerance limits and specification limits. How does a process capability index incorporate both of them? What assumptions are made in constructing the natural tolerance limits?
> Distinguish between gage repeatability and gage reproducibility in the context of measuring unloading times of super tankers.
> Discuss how the precision of a measurement system affects the process potential in the context of measuring unloading times of super tankers. What bounds exist on the observed process potential?
> Discuss the importance of identifying an appropriate distribution of the quality characteristic in process capability analysis. Address this in the context of waiting time for service in a fast-food restaurant during lunch hour.
> Explain the difference between specification limits and control limits. Is there a desired relationship between the two?
> Discuss the role of the customer in influencing the proportion-nonconforming chart. How would the customer be integrated into a total quality systems approach?
> Classify each of the following into the cost categories of prevention, appraisal, internal failure, and external failure: (a) Vendor selection (b) Administrative salaries (c) Downgraded product (d) Setup for inspection (e) Supplier control (f) External c
> Is it possible for a process to be in control and still not meet some desirable standards for the proportion nonconforming? How would one detect such a condition, and what remedial actions would one take?
> Discuss the assumptions that must be satisfied to justify using a p-chart. How are they different from the assumptions required for a c-chart?
> What are the advantages and disadvantages of the standardized p-chart as compared to the regular proportion-nonconforming chart?
> How does changing the sample size affect the center line and the control limits of a p-chart?
> The CEO of a company has been charged with reducing the proportion nonconforming of the product output. Discuss which control charts should be used and where they should be placed.
> Discuss the significance of an appropriate sample size for a proportion-nonconforming chart.
> What are the advantages and disadvantages of control charts for attributes over those for variables?
> Explain the setting under which a U-chart would be used. How does the U-chart incorporate the user’s perception of the relative degree of severity of the different categories of defects?
> Meeting customer due dates is an important goal. What attribute or variables control charts would you select to monitor? Discuss the underlying assumptions in each case.
> Distinguish between 3σ limits and probability limits. When would you consider constructing probability limits?
> A quality improvement program has been instituted in an organization to reduce total quality costs. Discuss the impact of such a program on prevention, appraisal, and failure costs.
> Explain why a p- or c-chart is not appropriate for highly conforming processes.
> Explain the conditions under which a u-chart would be used instead of a c-chart.
> Discuss the impact of the control limits on the average run length and the operating characteristic curve.
> Distinguish between a nonconformity and a nonconforming item. Give examples of each in the following contexts: (a) Financial institution (b) Hospital (c) Microelectronics manufacturing (d) Law firm (e) Non-profit organization
> A new hire has been made in a management consulting firm and data are monitored on response time to customer queries. Discuss what the patterns on an and R-chart might look like as learning on the job takes place.
> Explain the difference in interpretation between an observation falling below the lower control limit on an and one falling below the lower control limit on an R-chart. Discuss the impact of each on the revision of control charts in the con
> Patient progress in a health care facility is monitored over time for a certain diagnosis related group according to a few vital characteristics (systolic blood pressure, diastolic blood pressure, total cholesterol, weight). The characteristics, however,
> A start-up company promoting the development of new products can afford only a few observations from each product. Thus, a critical quality characteristic is selected for monitoring from each product. What type of control chart would be suitable in this
> What are some considerations in the interpretation of control charts based on standard values? Is it possible for a process to be in control when its control chart is based on observations from the process but to be out of control when the control chart
> Discuss specific characteristics that could be monitored through variable control charts, the form of data to collect, and the appropriate control chart in the following situations: (a) Waiting time to check in baggage at an airport counter (b) Product a
> An intermodal logistics company uses trucks, trains, and ships to distribute goods to various locations. What might be the various quality costs in each of the categories of prevention, appraisal, internal failure, and external failure?
> Discuss the preliminary decisions that must be made before you construct a control chart. What concepts should be followed when selecting rational samples?
> Describe the use of the Pareto concept in the selection of characteristics for control charts.
> Lung congestion may occur in illness among infants. However, it is not easily verifiable without radiography. To monitor an ill infant to predict whether lung opacity will occur on a radiograph, data are kept on age, respiration rate, heart rate, tempera
> What is the motivation behind constructing multivariate control charts? What advantages do they have over control charts for individual characteristics?
> Discuss the appropriate setting for using a modified control chart and an acceptance control chart. Compare and contrast the two charts.
> Discuss the importance of risk adjustment in monitoring mortality and related measures in a health care setting.

