Question: Table11.3.15 compares short-term bond
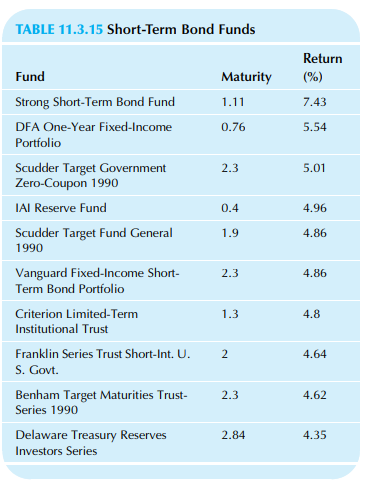
Table11.3.15 compares short-term bond funds, showing the average maturity (in years until the fund’s bonds mature) and the rate of return as a percentage.
a. Find the correlation between maturity and return and interpret it.
b. Find the least-squares regression equation to predict return from maturity.
c. What rate of return would you expect for a fund with a current maturity of exactly one year?
d. Find the standard error of prediction (for predicting “return†at a given maturity level) and explain its meaning.
e. Is there a significant relationship between maturity and return? How do you know?
Table 11.3.15:
Transcribed Image Text:
TABLE 11.3.15 Short-Term Bond Funds Return Fund Maturity (%) Strong Short-Term Bond Fund 1.11 7.43 DFA One-Year Fixed-Income 0.76 5.54 Portfolio Scudder Target Government Zero-Coupon 1990 2.3 5.01 IAI Reserve Fund 0.4 4.96 Scudder Target Fund General 1.9 4.86 1990 Vanguard Fixed-Income Short- Term Bond Portfolio 2.3 4.86 Criterion Limited-Term 1.3 4.8 Institutional Trust Franklin Series Trust Short-Int. U. 2 4.64 S. Govt. Benham Target Maturities Trust- 2.3 4.62 Series 1990 Delaware Treasury Reserves 2.84 4.35 Investors Series
> Table 14.4.7 shows basic computer results from a Box Jenkins analysis of the daily percentage changes in the Dow Jones Industrial stock market index from Jul. 31 to Oct. 9, 1987, prior to the crash of 1987. a. What kind of process has been estimated? b.
> For each of the following, tell whether it is likely to be stationary or non stationary and why. a. The price per share of Google stock, recorded daily. b. The prime rate, recorded weekly. This is the interest rate that banks charge their best customers
> Consider the time series of quarterly sales in thousands shown in Table 14.4.6. The seasonal indices are 0.89 for quarter 1, 0.88 for 2, 1.27 for 3, and 0.93 for 4. a. Find the seasonally adjusted sales corresponding to each sales value. b. In which quar
> The number of diners per quarter eating at your apre `s-ski restaurant has been examined using trend-seasonal analysis. The quarterly seasonal indexes are 1.45, 0.55, 0.72, and 1.26 for quarters 1, 2, 3, and 4, respectively. A linear trend has been estim
> What is your interpretation of the effectiveness of the ads in this study? What would you recommend in this situation?
> Based on past data, your firm’s sales show a seasonal pattern. The seasonal index for November is 1.08, for December it is 1.38, and for January it is 0.84. Sales for November were $285,167. a. Would you ordinarily expect an increase in sales from Novemb
> Consider PepsiCo’s quarterly net revenue as shown in Table 14.4.5. a. Draw a time-series plot for this data set. Describe any trend and seasonal behavior that you see. b. Plot the moving average values on the same graph as the original
> Amazon.com is an e-commerce firm that has shown considerable growth since its founding in 1995, and its quarterly net sales are shown in Table 14.4.4. Their 2014 annual report includes a section titled “Seasonality” th
> What important information is missing from each of the following references? a.* Personal communication, 2016. b. Business Week, p. 80. c. Basic Business Communication (Burr Ridge, Ill.: Richard D. Irwin). d. James A. White, “Will the Real S&P 500 Please
> Arrange selected information to form a proper reference for each of the following cases. a.* The title of the article from the Wall Street Journal is “Tallying Up Viewers: Industry Group to Study How a Mobile Nation Uses Media.” It appeared on July 26, 2
> Your boss has just asked you to write a report. Identify the purpose and audience in each of the following situations: a.* The firm is considering expansion of the shipping area. Background material is needed on the size of facilities at other firms. b.
> The unemployment rate can vary from one state to another, and in 2008 the standard deviation was 1.2% for the percent unemployed, which averaged 5.3% at the time. Table 12.5.5 shows these unemployment rates together with two possible explanatory variable
> Networked computers tend to slow down when they are overloaded. The response time is how long it takes from when you press the Enter key until the computer comes back with your answer. Naturally, when the computer is busier (either with users or with oth
> One might expect the price of a tent to reflect various characteristics; for example, we might expect larger tents to cost more, all else equal (because they will hold more people) and heavier tents to cost less, all else equal (because they are harder t
> How are prices set for computer processor chips? At one time, the frequency was a good indicator of the processing speed; however, more recently manufacturers have developed alternative ways to deliver computing power because a high frequency tends to le
> If the type I error is supposed to be controlled at 5%, how is it that in the computer simulation model, type I errors occurred 70% of the time?
> Table 12.5.1 shows data on Picasso paintings giving the price, area of canvas, and year for each one. a. Find the regression equation to predict price from area and year. b. Interpret the regression coefficient for area. c. Interpret the regression coeff
> sider the interest rates on securities with various terms to maturity, shown in Table 12.5.18. a. Find the regression equation to predict the long-term interest rate (Treasury bonds) from the two shorter term rates. b. Create a new variable, â€
> Consider the magazine advertising page-cost data. a. Which X variable is the least helpful in explaining page costs? How do you know? b. Rerun the regression analysis omitting this X variable. c. Compare the following results without the X variable to th
> Table 12.5.17 shows the results of a multiple regression analysis designed to explain the salaries of chief executive officers based on the sales of their firm and the industry group.36The Y variable represents CEO salary (in thousands of dollars). The X
> Setting prices is rarely an easy task. A low price usually results in higher sales, but there will be less profit per sale. A higher price produces higher profit per sale, but sales will be lower overall. Usually, a firm wants to choose the price that wi
> Consider Table 12.5.15, showing the partial results from a multiple regression analysis (with significant F test) that explains the annual sales of 25 grocery stores by some of theircharacteristics.Thevariable“mall”is1
> How do individual companies respond to economic forces throughout the globe? One way to explore this is to see how well rates of return for stock of individual companies can be explained by stock market indexes that reflect particular parts of the world.
> By switching suppliers, you believe that the standard deviation of the key input component can be reduced from 0.62 to 0.38, on average. Based on the multiple regression output from the preceding problem, what size reduction in defect rate should you exp
> A coworker of yours is very pleased, having just found an R2 value of 100% , indicating that the regression equation has explained all of the variability in Y (“profits”) based on the X variables “revenues” and “costs.” You then amaze this person by corr
> Consider the computer output in Table 12.5.12, part of an analysis to explain the final cost of a project based on management’s best guess of labor and materials costs at the time the bid was placed, computed from 25 recent contracts. All variables are m
> Choose two ads, one that is significant and one that is not. Verify significance based on the average, standard error, and n, to make sure that they are correct. Is it appropriate to use one-sided tests here?
> In many ways, nonprofit corporations are run much like other businesses. Charity organizations with larger operations would be expected to have a larger staff, although some have more overhead than others. Table 12.5.11 shows the number of paid staff mem
> Consider the multiple regression results shown in Table 12.5.10, which attempt to explain compensation of the top executives of 9 selected major motion picture corporations based on the revenues and the return on equity of the firms.35 For example, the d
> Table 12.5.9 shows some of the results of a multiple regression analysis to explain money spent on home food-processing equipment (Y) based on income (X1), education (X2), and money spent on sporting equipment(X3). All money variables represent total dol
> What explains the financial performance of brokerage houses? Table 12.5.8 shows the 1-year performance of asset-allocation blends of selected brokerage houses, together with the percentages recommended in stocks and bonds at the end of the period. a. Wha
> There is considerable variation in the amount CEOs of different companies are paid, and some of it might be explained by differences in company characteristics. Consider the information in Table 12.5.7 on CEO salaries, sales, and return on equity (ROE) f
> Using the donations database on the companion site, and using only people who made a donation in response to the current mailing, consider predicting the amount of a donation (named “Donation_D1” in the worksheet) from the indicator variable that tells i
> Using the donations database on the companion site, and using only people who made a donation in response to the current mailing, consider predicting the amount of a donation (named “Donation_D1” in the worksheet) from the median years of school complete
> In the territory versus sales example (based on the data from Table 11.2.3), the least-squares line to predict sales based on the population of the territory was found to be Expected sales = $1,371,744+$0:23675045 Population ð Þ
> This problem continues the analysis of McDonald’s and Dow Jones stock market data. a. Find the 95% confidence interval for the percent change in McDonald’s stock on a day in which the Dow Jones Index is unchanged. b. Find the 95% confidence interval for
> Consider the daily percent changes of McDonald’s stock price and those of the Dow Jones Industrial Average for trading days in the months of Jan. and Feb. 2010, as shown in Table 11.3.5. a. Draw a scatterplot of McDonaldâ€
> What is your best estimate, with confidence limits, for potential catalog sales?
> Consider the slightly scary topic of business bankruptcies. Table 11.3.4 shows data for each state on the number of failed businesses and the population in millions. a. Construct a scatterplot of business bankruptcies (Y) against population (X). Describe
> Consider the number of transactions and the total dollar value of merger and acquisition deals in the oil and gas industry, from Table 11.1.6. a. Find the regression equation for predicting the dollar value from the number of transactions. b. What is the
> Closed-end funds sell shares in a fixed basket (portfolio) of securities (as distinguished from ordinary mutual funds, which continuously buy and sell shares of securities). Consider the net asset value and the market price for Sector Equity Funds, as sh
> Your firm is having a quality problem with the production of plastic automotive parts: There are too many defectives. One of your engineers thinks the reason is that the temperature of the process is not controlled carefully enough. Another engineer is s
> Microsoft is a company that sells its products in many countries all over the world. Use the data from Table 11.3.18 to explore how its market price movements relate to more general movements in the global economy. a. Is Microsoft significantly related t
> Many companies do not restrict themselves to operating inside any particular country, instead choosing to participate in the global economy, and stock market movements should reflect this reality. Consider data on the monthly percentage changes in stock
> Now consider also the daily percentage changes in the price of a dollar in Japanese yen from Table 11.3.17, along with the euro. a. Create a scatterplot of the euro’s against the yen’s percentage changes. b. Given that
> Consider the international currency markets and, in particular, whether geographical proximity implies association with respect to market movements. Because the United Kingdom kept the pound and did not convert to the euro, we can examine changes of thes
> Table 11.3.2 shows the on-time performance of nine airlines, both for 1 month (May 2010) and for the preceding 4 months (Jan. to Apr. 2010). These numbers represent percentages off lights that arrived on time. We will investigate the consistency of perfo
> From Table 11.3.16, consider the daily production and the number of workers assigned for each of a series of days. a. Find the regression equation for predicting production from the number of workers. b. What is the estimated production amount attributab
> Should anything else trouble you about this situation?
> Table 11.3.14 gives mailing-list size (thousands of names) and sales (thousands of dollars) for a group of catalogs. a. How strong is the association between these two variables? Find the appropriate summary measure and interpret it. b. Find the equation
> High salaries for presidents and high executives of charitable organizations have been in the news from time to time. Consider the information in Table 11.3.13 for the United Way in 10 major cities. a. What percent of the variation in presidentsâ&#
> Consider the retail price of regular gasoline at selected locations and times shown in Table 11.3.12. a. How strong is the association between prices in 2010 and prices a year earlier? Please give both a number and its interpretation in words. b. Find th
> A linear regression analysis has produced the following equation relating profits to hours of managerial time spent developing the past year’s projects at a firm: Profits= -$957+$85 × Number of hours a. According to this estimated relationship, how large
> Are top executives of larger companies paid significantly more than those of smaller companies? Consider data on CEO pay (dollars) and market capitalization (the total market value of stock, in $millions) for a sample of companies, as shown in Table 11.3
> Consider the weight and price of gold coins from Table 11.3.10. a. How strong is the association between weight and price for these coins? Please give both a number and its interpretation in words. b. Find the regression equation to predict price from we
> Gaining visibility for your products can be expensive, and television advertising during the Super Bowl is a good example, with a cost of nearly $2 million for a 30-s message. This high cost is due, in part, to the large number of Super Bowl viewers. Tab
> How predictable are advertising budgets from year to year? Consider the 2008 and 2009 advertising spending of selected firms as reported in Table 11.3.8. a. Summarize the strength of the year-to-year relationship in advertising budget by computing and in
> In the presidential election of 2000, a number of events occurred between the initial vote count of Nov.7 and the count as certified by the Florida Secretary of State following counting of absentee ballots, a machine recount, and a Florida Supreme Court
> Would it be better to multiply by the size of the frame used to select the random sample?
> Do separate histograms for Owen and Purcell agree with Billings’s contention that Owen spends more?
> Consider the expense ratio and the total one-year rate of return on the W&R family of mutual funds in Table 11.3.6. a. What percentage of the variation in rate of return is explained by expense ratio? Please provide both the name of the measure and i
> Using the donations database on the companion site, and using only people who made a donation in response to the current mailing, consider predicting the amount of a donation (named “Donation_D1” in the worksheet) from the percentage of households in the
> Using the donations database on the companion site, and using only people who made a donation in response to the current mailing, consider predicting the amount of a donation (named “Donation_D1” in the worksheet) from the percentage of households in the
> Consider the data set in Table 11.3.1, representing the ages (in years) and maintenance costs (in thousands of dollars per year) for five similar printing presses. a. Draw a scatterplot of this data set. What kind of relationship do you see? b. Find the
> Your bakery produces loaves of bread with “1 pound” written on the label. Here are weights of randomly sampled loaves from today’s production: 1.02,0.97, 0.98,1.10,1.00, 1.02,0.98, 1.03,1.03, 1.05, 1.02, 1.06 a. Find the 95% confidence interval for the m
> Your factory’s inventory level was determined at 12 randomly selected times last year, with the following results: 313, 891, 153, 387, 584, 162, 742, 684, 277, 271, 285, 845 a. Find the typical inventory level throughout the whole year, using the standar
> In a random sample of 725 selected for interview from your database of 13,916 customers, 113 said they are dissatisfied with your company’s service. a. Find the best estimate of the percentage of all customers in your entire database who are dissatisfied
> A cup of coffee is found to have only 72.8 milligrams of caffeine. Test (at the 5% level) whether the beans used could have come from the same population as those that generated the data in problem 47 of Chapter 9. Data from problem 47: The amount of c
> Repeat problem 49 for yet another product. For 158 outgoing consumers, the average rating was 7.93, and the standard deviation was 2.03. For 224 shy consumers, the average rating was 8.11, and the standard deviation was 1.55. Data from Problem 49: You
> Repeat the previous problem for a different product. For 142 outgoing consumers, the average rating was 7.28, and the standard deviation was 2.18. For 277 shy consumers, the average rating was 8.78, and the standard deviation was 1.32. Data from Problem
> Is it proper to multiply the average order size, $42.33, by the number of addresses (1,300,000) in the target mailing?
> Some of your advertisements seem to get no reaction, as though they are being ignored by the public. You have arranged for a study to measure the public’s awareness of your brand before and after viewing a TV show that includes the advertisement in quest
> You are analyzing the results of a consumer survey of a product, rated on a scale from 1 to 10. For the 130 consumers who described themselves as “outgoing,” the average rating was 8.36, and the standard deviation was 1.82. For the 218 “shy” consumers, t
> Your Detroit division produced 135 defective parts out of the total production of 983 last week. The Kansas City division produced 104 defectives out of 1,085 produced during the same time period. a. Find the percent defective for each division and compa
> Consider the weights for two samples of candy bars, before and after intervention, from Table 5.5.4. a. Is this a paired or an unpaired situation? b. Find the 95% confidence interval for the population mean difference in weight per candy bar (after minus
> To help you decide which of your two current suppliers deserves the larger contract next year, you have rated a random sample of plastic cases from each one. The data are a composite of several measurements, with higher numbers indicating higher quality
> There are two manufacturing processes, old and new, that produce the same product. The defect rate has been measured for a number of days for each process, resulting in the following summaries (Table 10.7.10). a. By how much would we estimate that the de
> An advertising study interviewed six randomly selected people in each of two cities, recording each person’s level of preference for a new product (Table 10.7.9). a. Is this a paired or an unpaired two-sample problem? b. Find the averag
> Child care is one of life’s necessities for working parents. Monthly rates per child at a sample of family day care centers in the North Seattle area are shown in Table 10.7.8. The Laurelhurst area is considered to be a highly desirable
> To understand your competitive position, you have examined the reliability of your product as well as the reliability of your closest competitor’s product. You have subjected each product to abuse that represents about a yearâ
> A group of experts has rated your winery’s two best varietals. Ratings are on a scale from 1 to 20, with higher numbers being better. The results are shown in Table 10.7.6. a. Is this a paired or unpaired situation? Why? b. Find the ave
> Are there useful results here? Which ones are useful? Are they sufficient, or is further study needed?
> Stress levels were recorded during a true answer and a false answer given by each of six people in a study of lie detecting equipment, based on the idea that the stress involved in telling a lie can be measured. The results are shown in Table 10.7.5. a.
> Why do firms change ownership? One possible reason for acquisitions is that the new owners expect to be able to manage the operations more efficiently than the current management. This theory leads to testable hypotheses. For example, it predicts that pr
> Last year you received an average of 129.2 complaints (i e, individual items to be fixed under warranty) per new car sold, with a standard deviation of 42.1 complaints based on 3,834 new cars sold. This year you have set up a quality assurance program to
> Your broker achieved a rate of return of 18.3% on your portfolio last year. For a sample of 25 other brokers in the area, according to a recent news article, the average rate of return was 15.2% with a standard deviation of 3.2% (as percentage points). a
> World investments markets were highly volatile in 1998. Table 10.7.4 shows one-year rates of return on closed end mutual funds that specialize in in come from international sources. a. Do the rates of return of these closed-end world income funds, as a g
> Selected mutual funds that practice socially aware investing, with year-to-date rates of return, are shown in Table 10.7.3. On average, these funds lost value in the first half of 2010, in the sense that their average rate of return was negative. However
> Do employees take more sick leave in the year before retirement? They may well have an incentive to do so if their accumulated paid sick leave (the number of days they are entitled to be away with full pay) is about to expire. Indeed, this appears to hap
> Dishwasher detergent is packaged in containers that claim a weight of 24 ounces. Although there is some variation from one package to another, your policy is to ensure that the mean weight for each day’s production is slightly over 24 ounces. A random sa
> You are supervising an audit to decide whether or not any errors in the recording of account transactions are “material errors.” Each account has a reported balance, whose accuracy can be verified only by careful and costly investigation; the account’s e
> The goal of your marketing campaign is for more than 25% of supermarket shoppers to recognize your brand name. A recent survey of 150 random shoppers found that 21.3% recognized your brand name. a. It might be argued that the burden of proof is to show t
> How might you explain differences among averages in the results?
> Managers perceived employee stock ownership as having a significant positive effect on product quality. As part of that same study, managers were also asked to rate the effect of employee stock ownership on unit labor cost.24 This effect, on a scale from
> Part of the assembly line will need adjusting if the consistency of the injected plastic becomes either too viscous or not viscous enough as compared with a value (56.00) your engineers consider reasonable. You will decide to adjust only if you are convi
> A recent poll of 1,423 randomly sampled likely voters shows your favorite candidate ahead, with 51.93% in favor. There are two candidates. Use hypothesis testing to infer to the larger group of all likely voters to see whether or not this indicates that
> A manufacturing process is considered to be “in control” if the long run mean weight of components produced is 0.20 kilograms, even though individual components may vary from this mean. Here are weights of a random sample of recently produced components:
> Regulations require that your factory provide convincing evidence that it discharges less than 25 milligrams of a certain pollutant each week, on average, over the long run. A recent sample shows weekly amounts of 13, 12, 10, 8, 22, 14, 10, 15, 9, 10, 6,
> Consider the dollar value (in thousands) of gifts returned to each of your department stores after the holiday season (Table 10.7.2): a. Compute the standard deviation. b. Interpret the standard deviation as a measure of the variation from one store to a
> Some frozen food dinners were randomly selected from this week’s production and destroyed in order to measure their actual calorie content. The claimed calorie content is 200. Here are the calorie counts for each dinner: 221, 198, 203, 223, 196, 202, 219

