Question: The age distribution of the residents of
The age distribution of the residents of Kadoka, South Dakota, is shown at the left. Find the probability of the event.
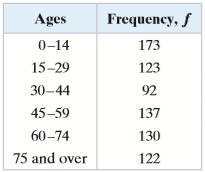
Event D: randomly choosing a resident who is not 75 years old or older
Transcribed Image Text:
Ages Frequency, f 0-14 173 15-29 123 30-44 92 45-59 137 60-74 130 75 and over 122
> A horse race has 12 entries. Assuming that there are no ties, what is the probability that the three horses owned by one person finish first, second, and third?
> Organize the data using the indicated type of graph. Describe any patterns. Use a stem-and-leaf plot to display the data shown in the table at the left, which represent the monthly average prices (in dollars per pound) charged by 30 retail outlets for fr
> The University of California Health Services committee has five members. Two members are chosen to serve as the committee chair and vice chair. Each committee member is equally likely to serve in either of these positions. What is the probability of rand
> The U.S. Senate Committee on Homeland Security and Governmental Affairs has 15 members. Two members are chosen to serve as the committee chair and the ranking member. Each committee member is equally likely to serve in either of these positions. What is
> A property inspector is visiting 24 properties. Six of the properties are one acre or less in size, and the rest are greater than one acre in size. Eight properties are randomly selected. Using technology, how many ways could three properties that are ea
> An environmental agency is analyzing water samples from 80 lakes for pollution. Five of the lakes have dangerously high levels of dioxin. Six lakes are randomly selected from the sample. Using technology, how many ways could one polluted lake and five no
> A floral arrangement consists of 6 different colored roses, 3 different colored carnations, and 3 different colored daisies. You can choose from 8 different colors of roses, 6 different colors of carnations, and 7 different colors of daisies. How many di
> A restaurant offers a dinner special that lets you choose from 10 entrées, 8 side dishes, and 13 desserts. You can choose one entrée, one side dish, and two desserts. How many different meals are possible?
> A lottery has 52 numbers. In how many different ways can 6 of the numbers be selected? (Assume that order of selection is not important.)
> A class has 40 students. In how many different ways can three students form a group to work on a class project? (Assume the order of the students is not important.)
> From a group of 36 people, a jury of 12 people is selected. In how many different ways can a jury of 12 people be selected?
> In order to conduct an experiment, 4 subjects are randomly selected from a group of 20 subjects. How many different groups of four subjects are possible?
> What is an advantage of using a stem-and-leaf plot instead of a histogram? What is a disadvantage?
> A byte is a sequence of eight bits. A bit can be a 0 or a 1. In how many distinguishable ways can you have a byte with five 0’s and three 1’s?
> In how many distinguishable ways can the letters in the word statistics be written?
> You are putting 9 pieces of blue beach glass, 3 pieces of red beach glass, and 7 pieces of green beach glass on a necklace. In how many distinguishable ways can the beach glass be put on the necklace?
> At a blood drive, 8 donors with type O+ blood, 6 donors with type A+ blood, and 3 donors with type B+ blood are in line. In how many distinguishable ways can the donors be in line?
> An archaeology club has 38 members. How many different ways can the club select a president, vice president, treasurer, and secretary?
> A DJ is preparing a playlist of 24 songs. How many different ways can the DJ choose the first six songs?
> There are 16 finalists in a singing competition. The top five singers receive prizes. How many ways can the singers finish first through fifth?
> There are 50 runners in a race. How many ways can the runners finish first, second, and third?
> The starting lineup for a softball team consists of 10 players. How many different batting orders are possible using the starting lineup?
> In how many ways can the letters A, B, C, D, E, and F be arranged for a six-letter security code?
> Organize the data using the indicated type of graph. Describe any patterns. Use a stem-and-leaf plot to display the data, which represent the thicknesses (in centimeters) of ice measured at 20Â different locations on a frozen lake. 5.8 6.4
> Eight people compete in a downhill ski race. Assuming that there are no ties, in how many different orders can the skiers finish?
> You have seven different video games. How many different ways can you arrange the games side by side on a shelf?
> Determine whether the situation involves permutations, combinations, or neither. Explain your reasoning. The number of four-letter passwords that can be created when no letter can be repeated
> Determine whether the situation involves permutations, combinations, or neither. Explain your reasoning. The number of ways 2 captains can be chosen from 28 players on a lacrosse team
> Determine whether the situation involves permutations, combinations, or neither. Explain your reasoning. The number of ways a four-member committee can be chosen from 10 people
> Determine whether the situation involves permutations, combinations, or neither. Explain your reasoning. The number of ways 16 floats can line up in a row for a parade
> Perform the indicated calculation. 7P3/12P4
> Perform the indicated calculation. 3P2/13P1
> Perform the indicated calculation. 10C7/14C7
> Perform the indicated calculation. 8C4/12C6
> Organize the data using the indicated type of graph. Describe any patterns. Use a stem-and-leaf plot to display the data, which represent the numbers of hours 24 nurses work per week. 30 24 40 36 40 36 40 39
> Perform the indicated calculation. 21C8
> Perform the indicated calculation. 8C3
> Perform the indicated calculation. 14P3
> Perform the indicated calculation. 9P5
> Determine whether the statement is true or false. If it is false, rewrite it as a true statement. 7C5 = 7C2
> Determine whether the statement is true or false. If it is false, rewrite it as a true statement. When you divide the number of permutations of 11 objects taken 3 at a time by 3!, you will get the number of combinations of 11 objects taken 3 at a time.
> Determine whether the statement is true or false. If it is false, rewrite it as a true statement. The number of different ordered arrangements of n distinct objects is n!.
> Determine whether the statement is true or false. If it is false, rewrite it as a true statement. A combination is an ordered arrangement of objects.
> When you calculate the number of combinations of r objects taken from a group of n objects, what are you counting? Give an example.
> When you calculate the number of permutations of n distinct objects taken r at a time, what are you counting? Give an example.
> Organize the data using the indicated type of graph. Describe any patterns. Use a stem-and-leaf plot to display the data, which represent the scores of a biology class on a midterm exam. 75 85 90 80 87 67 82 88 95 91 73 80 83 92 94 68 75 91 79 95 87
> Determine whether the events are mutually exclusive. Explain your reasoning. Event A: Randomly select a male psychology major. Event B: Randomly select a psychology major who is 20 years old.
> Determine whether the events shown in the Venn diagram are mutually exclusive. Explain your reasoning. Sample Space: Movies Movies that are Movies rated R that are rated PG-13
> Determine whether the events shown in the Venn diagram are mutually exclusive. Explain your reasoning. Sample Space: Presidential Candidates Presidential candidates Presidential candidates the popular who won the who lost vote election
> The age distribution of the residents of Kadoka, South Dakota, is shown at the left. Find the probability of the event. Event C: randomly choosing a resident who is not 14 years old or younger Ages Frequency, f 0-14 173 15-29 123 30-44 92 45-59 137
> The age distribution of the residents of Kadoka, South Dakota, is shown at the left. Find the probability of the event. Event B: randomly choosing a resident who is not 45 to 59 years old Ages Frequency, f 0-14 173 15-29 123 30-44 92 45-59 137 60-74
> Determine whether the statement is true or false. If it is false, explain why. If events A and B are mutually exclusive, then P(A or B)= P(A)+ P(B).
> The age distribution of the residents of Kadoka, South Dakota, is shown at the left. Find the probability of the event. Event A: randomly choosing a resident who is not 15 to 29 years old Ages Frequency, f 0-14 173 15-29 123 30-44 92 45-59 137 60-74
> Classify the statement as an example of classical probability, empirical probability, or subjective probability. Explain your reasoning. You think that a football team’s probability of winning its next game is about 0.80.
> Classify the statement as an example of classical probability, empirical probability, or subjective probability. Explain your reasoning. The probability that a randomly selected number from 1 to 100 is divisible by 6 is 0.16.
> Give three observations that can be made from the graph. Amount Spent on Pet Care 10 Туре of care Amount spent (in billions) pon SuppliesOTC medicine Veterinarian care Supaog sogund
> Classify the statement as an example of classical probability, empirical probability, or subjective probability. Explain your reasoning. According to a survey, the probability that an adult chosen at random is in favor of a sprinkling ban is about 0.45.
> Classify the statement as an example of classical probability, empirical probability, or subjective probability. Explain your reasoning. An analyst feels that a certain stock’s probability of decreasing in price over the next week is 0.75.
> Classify the statement as an example of classical probability, empirical probability, or subjective probability. Explain your reasoning. The probability of choosing 6 numbers from 1 to 40 that match the 6 numbers drawn by a state lottery is 1/3,838,380 ≈
> Classify the statement as an example of classical probability, empirical probability, or subjective probability. Explain your reasoning. According to company records, the probability that a washing machine will need repairs during a six-year period is 0.
> Use the frequency distribution at the left, which shows the number of voting-age American citizens (in millions) by age, to find the probability that a citizen chosen at random is in the age range. 65 years old and older Frequency, f (in millions) A
> Use the frequency distribution at the left, which shows the number of voting-age American citizens (in millions) by age, to find the probability that a citizen chosen at random is in the age range. 45 to 64 years old Frequency, f (in millions) Ages
> Use the frequency distribution at the left, which shows the number of voting-age American citizens (in millions) by age, to find the probability that a citizen chosen at random is in the age range. 30 to 44 years old Frequency, f (in millions) Ages
> Determine whether the statement is true or false. If it is false, explain why. The probability that event A or event B will occur is P(A or B)= P(A)+ P(B) + P(A and B)
> Use the frequency distribution at the left, which shows the number of voting-age American citizens (in millions) by age, to find the probability that a citizen chosen at random is in the age range. 18 to 29 years old Frequency, f (in millions) Ages
> A polling organization is asking a sample of U.S. adults how many tattoos they have. The frequency distribution at the left shows the results. Use the frequency distribution. /’ What is the probability that the next person asked has two tattoos?
> Give three observations that can be made from the graph. Least Popular American Drivers The Multitasker 8% - The Swerver 8% The Crawler 8% The Speeder 5% The Left-Lane Hog 11% - The Drifter 5% Other 6% -The Texter The Last-Minute Line-Cutter 13% 22%
> A polling organization is asking a sample of U.S. adults how many tattoos they have. The frequency distribution at the left shows the results. Use the frequency distribution. /’ What is the probability that the next person asked does not have a tattoo?
> A probability experiment consists of rolling a 12-sided die, numbered 1 to 12. Find the probability of the event. Event F: rolling a number divisible by 5
> A probability experiment consists of rolling a 12-sided die, numbered 1 to 12. Find the probability of the event. Event E: rolling a number divisible by 3
> A probability experiment consists of rolling a 12-sided die, numbered 1 to 12. Find the probability of the event. Event D: rolling a number less than 8
> A probability experiment consists of rolling a 12-sided die, numbered 1 to 12. Find the probability of the event. Event C: rolling a number greater than 4
> • The probability that an airplane flight departs on time is 0.89. • The probability that a flight arrives on time is 0.87. • The probability that a flight departs and arrives on time is 0.83. Find the probability that a flight arrives on time given th
> • The probability that an airplane flight departs on time is 0.89. • The probability that a flight arrives on time is 0.87. • The probability that a flight departs and arrives on time is 0.83. Find the probability that a flight departed on time given t
> You are in a class that has 24 students. You want to find the probability that at least two of the students have the same birthday. a. Find the probability that each student has a different birthday. b. Use the result of part (a) to find the probabilit
> Determine whether the statement is true or false. If it is false, explain why. When two events are independent, they are also mutually exclusive.
> A virus infects one in every 200 people. A test used to detect the virus in a person is positive 80% of the time when the person has the virus and 5% of the time when the person does not have the virus. (This 5% result is called a false positive.) Let A
> Give three observations that can be made from the graph. Motor Vehicle Thefts at U.S. Universities and Colleges 1900 1880- 1800 1750 1700 1650 1600 2010 2011 2012 2013 2014 2015 Year Thefts
> Use Bayes’ Theorem to find P(A|B). P(A)= 12%, P(A′)= 88%, P(B|A)= 66%, and P(B|A′)= 19%
> Use Bayes’ Theorem to find P(A|B). P(A)= 73%, P(A′)= 17%, P(B|A)= 46%, and P(B|A′)= 52%
> Use Bayes’ Theorem to find P(A|B). P(A)= 0.62, P(A′)= 0.38, P(B|A)= 0.41, and P(B|A′)= 0.17
> Use Bayes’ Theorem to find P(A|B). P(A)= 0.25, P(A′)= 0.75, P(B|A)= 0.3, and P(B|A′)= 0.5
> Use Bayes’ Theorem to find P(A|B). P(A)= 3/8, P(A′)= 5/8, P(B|A)= 2/3, and P(B|A′)= 3/5
> Use Bayes’ Theorem to find P(A|B). P(A)= 2/3, P(A′)= 1/3, P(B|A)= 1/5, and P(B|A′)= 1/2
> Use the Multiplication Rule. A doctor gives a patient a 60% chance of surviving bypass surgery after a heart attack. If the patient survives the surgery, then the patient has a 50% chance that the heart heals. Find the probability that the patient surviv
> Use the Multiplication Rule. According to a study, 80% of K–12 schools or districts in the United States use digital content such as ebooks, audio books, and digital textbooks. Of these 80%, 4 out of 10 use digital content as part of their curriculum. Fi
> Can two events with nonzero probabilities be both independent and mutually exclusive? Explain your reasoning.
> Determine whether the statement is true or false. If it is false, explain why. When two events are mutually exclusive, they have no outcomes in common.
> Give three observations that can be made from the graph. Monthly Active Users on 5 Social Networking Sites as of September 2016 1750 1500 1250 1000 750 500 250 Site Number of users (in millions) Instagram Twitter Pinterest
> Explain, in your own words, why in the Addition Rule for P(A or B or C), P(A and B and C) is added at the end of the formula.
> In the Venn diagram, P(A or B or C) is represented by the blue areas. Find P(A or B or C). P(A)= 0.38, P(B)= 0.26, P(C)= 0.14, P(A and B)= 0.12, P(A and C)= 0.03, P(B and C)= 0.09, P(A and B and C)= 0.01 B
> In the Venn diagram, P(A or B or C) is represented by the blue areas. Find P(A or B or C). P(A)= 0.40, P(B)= 0.10, P(C)= 0.50, P(A and B)= 0.05, P(A and C)= 0.25, P(B and C)= 0.10, P(A and B and C)= 0.03 B
> The table shows the results of a survey that asked 3203 people whether they wore contacts or glasses. A person is selected at random from the sample. Find the probability of each event. a. The person wears only contacts or only glasses. b. The person i
> The table shows the results of a survey that asked 2850 people whether they were involved in any type of charity work. A person is selected at random from the sample. Find the probability of each event. a. The person is male or frequently involved in ch
> The table shows the results of a survey that asked 506 Maine adults whether they favored or opposed a tax to fund education. A person is selected at random from the sample. Find the probability of each event. a. The person oppose
> The table shows the numbers of male and female students in the U.S. who received bachelor’s degrees in business in a recent year. A student is selected at random. Find the probability of each event. a. The student is male or received
> The responses of 1007 American adults to a survey question about the story of Britons’ vote to leave the European Union are shown in the Pareto chart. Find the probability of each event. a. Randomly selecting an adult who thinks the st
> The responses of 1254 voters to a survey about the way the media conducted themselves in the 2016 presidential campaign are shown in the Pareto chart. Find the probability of each event. a. Randomly selecting a person from the sample who did not give the
> The percent of college students’ marijuana use for a sample of 95,761 students is shown in the pie chart. Find the probability of each event. a. Randomly selecting a student who never used marijuana b. Randomly selecting a student who
> Use the stem-and-leaf plot or dot plot to list the actual data entries. What is the maximum data entry? What is the minimum data entry? .... 215 220 225 230 215

