Question: The following data represent the land area
The following data represent the land area and highest elevation for each of the seven continents.
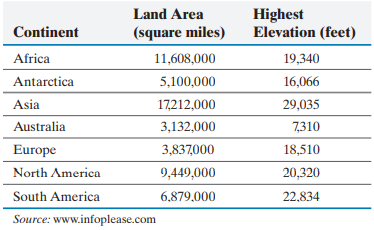
(a) Would it make sense to draw a pie chart for land area? Why? If so, draw a pie chart.
(b) Would it make sense to draw a pie chart for the highest elevation? Why? If so, draw a pie chart.
> The following data represent the number of hurricanes in the Atlantic Ocean for the years 2000 to 2017. (a) Construct a time-series plot of the data. (b) See Problem 37(b). What was percentage change from 2015 to 2016? What was the percentage change fr
> The following data represent the total federal debt (in trillions of dollars) of the United States from 2000 to 2018. (a) Construct a time-series plot of the data. (b) Percentage change may be found using the formula: is, the debt increased 1.8% from 20
> Draw a dot plot of the waiting data from Problem 26.
> Draw a dot plot of the televisions per household data from Problem 25.
> What is the ideal number of children to have? This question was asked on the Sullivan Statistics Survey I. Draw a dot plot of the variable “Children” from the SullivanStatsSurveyI data set at www.pearsonhighered.com/ sullivanstats. Now draw a dot plot of
> Payscale.com tracks the graduates of all institutions of higher education and determines the return on investment (ROI) of the school’s graduates. ROI can be thought of as the investment return on the expenses associated with attending college. Go to www
> The volume of a stock is the number of shares traded on a given day. The following data, in millions, so that 6.42 represents 6,420,000 shares traded, represent the volume of Altria Group stock traded for a random sample of 35 trading days in 2018. (a) I
> Year of birth of college students
> The following data represent the default rate on student loans for a random sample of 40 colleges or universities in the United States. (a) If seven classes are to be formed, choose an appropriate lower class limit for the first class and a class width.
> The table shows the tax, in dollars, on a pack of cigarettes in each of the 50 states and Washington, DC, as of January 2015. Note: The state with the lowest tax is Missouri and the state with the highest tax is New York. With a first class having a
> The following data represent the exit velocity (in miles per hour) for a simple random sample of 50 homeruns hit during the 2018 Major League Baseball season. With a first class having a lower class limit of 90 and a class width of 4: (a) Construct a rel
> The following data represent the median household income (in dollars) for the 50 states and the District of Columbia in 2017. With the first class having a lower class limit of 40,000 and a class width of 5000: (a) Construct a frequency distribution. (b)
> The Gini Index is a measure of how evenly income is distributed within a country, ranging from 0 to 100. An index of 0 suggests income is distributed with perfect equality. The higher the number, the worse the income inequality. The data below represent
> The data below represent the number of customers waiting for a table at 6:00 P.M. for 40 consecutive Saturdays at Bobak’s Restaurant. (a) Are these data discrete or continuous? Explain. (b) Construct a frequency distribution of the data. (c) Construct a
> A researcher with A. C. Nielsen wanted to determine the number of televisions in households. He conducts a survey of 40 randomly selected households and obtains the following data. (a) Are these data discrete or continuous? Explain. (b) Construct a frequ
> Use the data in Problem 22. What percentage of earthquakes registered 4.0 to 4.9? What percentage of earthquakes registered less than 5.0?
> Use the data in Problem 21. What percentage of players had a sprint speed between 24 and 25.9 ft/sec? What percentage of players had a sprint speed less than 24 ft/sec?
> The following data represent the magnitude of earthquakes worldwide in October 2018.
> Volume of water used by a household in a day
> The following frequency distribution represents the sprint speed (in feet per second) of all players in Major League Baseball during the 2018 baseball season.
> In an experiment, a researcher asks a basketball player to record the number of free throws she shoots until she misses. The experiment is repeated 50 times. The following table lists the distribution of the number of free throws attempted until a miss i
> To predict future enrollment in a school district, fifty households within the district were sampled, and asked to disclose the number of children under the age of five living in the household. The results of the survey are presented in the following tab
> The following time-series plot shows the average age at which individuals first marry by gender for each year of the census since 1890. (a) To the nearest year, what was the average age of a man who first married in 1980? (b) To the nearest year, what wa
> The following time-series plot shows the annual unemployment and inflation rates for the years 2001 through 2017. Source: www.miseryindex.us (a) Estimate the unemployment rate in 2012. (b) In what year was the unemployment rate highest? (c) In what year
> The following dot plot drawn in Minitab shows the number of people living in a household for a random sample of households in the United States. (a) If you randomly selected a household, what is the most likely number of people living in the household? (
> A student conducted a survey asking a random sample of adults, “How many days per week do you exercise?”. The results of the survey are displayed in the dot plot drawn in StatCrunch shown below. (a) What is the most popular number of days to exercise? (b
> (a) Number of alcoholic drinks consumed per week (b) Ages of students in a public school district (c) Ages of hearing-aid patients (d) Heights of full-grown men
> (a) Annual household incomes in the United States (b) Scores on a standardized exam such as the SAT (c) Number of people living in a household (d) Ages of patients diagnosed with Alzheimer’s disease
> The frequency histogram represents the number of alcohol-related traffic fatalities by state (including Washington, D.C.) in 2016 according to the National Highway Traffic Safety Administration. (a) Determine the class width. (b) Identify the classes
> Movie ratings of one star through five stars
> The following frequency histogram represents the IQ scores of a random sample of seventh-grade students. IQs are measured to the nearest whole number. The frequency of each class is labeled above each rectangle. (a) How many students were sampled? (b) De
> A car salesman records the number of cars he sold each week for the past year. The following frequency histogram shows the results. (a) What is the most frequent number of cars sold in a week? (b) For how many weeks were two cars sold? (c) Determine the
> An experiment was conducted in which two fair dice were thrown 100 times. The sum of the pips showing on the dice was then recorded. The following frequency histogram gives the results. (a) What was the most frequent outcome of the experiment? (b) What w
> True or False: The shape of the distribution shown is best classified as uniform.
> True or False: The shape of the distribution shown is best classified as skewed left.
> True or False: Suppose the first class of a frequency distribution is 0–9.9 and the second class is 10–19.9. Then, the class width is 9.9.
> True or False: There is not one particular frequency distribution that is correct, but there are frequency distributions that are less desirable than others.
> What does it mean if a distribution is said to be “skewed left”?
> In a relative frequency distribution, what should the relative frequencies add up to?
> A frequency distribution lists the______ of occurrences of each category of data, while a relative frequency distribution lists the ______of occurrences of each category of data.
> Nation of origin
> Define raw data in your own words.
> Consider the information in the chart shown below, which is in the USA Today style of graph. Could the information provided be organized into a pie chart? Why or why not?
> Describe the circumstances in which a bar graph is preferable to a pie chart. When is a pie chart preferred over a bar graph? Are there circumstances in which a pie chart cannot be drawn, but a bar graph could be drawn? What are these circumstances?
> Suppose you need to summarize ordinal data in a bar graph. How would you arrange the categories of data on the horizontal axis? Is it possible to make the order of the data apparent in a pie chart?
> When should relative frequencies be used when comparing two data sets? Why?
> Keeping students engaged in the learning process greatly increases their chance of success in a course. Traditional lecture-based math instruction has given way to a more student-engaged approach where students interact with the teacher in class and rece
> Choose a qualitative variable from the Sullivan StatCrunch Survey I data set at www.pearsonhighered.com/sullivanstats and summarize the variable by gender.
> Choose a qualitative variable from the Sullivan StatCrunch Survey I data set at www.pearsonhighered.com/sullivanstats and summarize the variable.
> The data set “Tornadoes_ 2017” located at www.pearsonhighered.com/sullivanstats contains a variety of variables that were measured for all tornadoes in the United States in 2017. F scale is a qualitative variable that categorizes tornadoes by their wind
> Air pressure in pounds per square inch in an automobile tire
> Type A phlebotomist draws the blood of a random sample of 50 patients and determines their blood types as shown: (a) Construct a frequency distribution. (b) Construct a relative frequency distribution. (c) According to the data, which blood type is most
> The following data represent the day of the week an order was placed for groceries using the online grocery delivery service Instacart. (a) Construct a frequency and relative frequency distribution. (b) If you own an Instacart franchise, what day would y
> A survey was conducted by Wakefield Research in which participants were asked to disclose their favorite night to order takeout for dinner. The following data are based on their results. (a) Construct a frequency distribution. (b) Construct a relative fr
> The table shows the movement of Walt Disney stock for 30 randomly selected trading days. “Up” means the stock price increased in value for the day, “Down” means the stock price decreased in value for the day, and “No Change” means the stock price closed
> A survey of 100 randomly selected autos in the luxury car segment and 100 randomly selected autos in the sports car segment that were recently purchased yielded the following colors. (a) Construct a relative frequency distribution for each car type. (b)
> A survey of adult men and women asked, “Which one of the following jobs would you most like to have?” The results of the survey are shown in the table. (a) Construct a relative frequency distribution for men and women. (b) Construct a side-by-side relati
> A survey of U.S. adults and teens (ages 12–17) was administered by Pew Research, to determine the number of texts sent in a single day. (a) Construct a relative frequency distribution for adults. (b) Construct a relative frequency distribution for teens.
> A random sample of college students was asked, “What social platform most influences your online shopping?” Results are shown below. (a) Construct a relative frequency distribution for males. (b) Construct a relative frequency distribution for females.
> A sample of 521 adults was asked, “How often do you dine out?” The results of the survey are given in the table in the next column. (a) Construct a relative frequency distribution. (b) What proportion of those surveyed dine out once or twice a week? (c)
> The Gallup organization conducted a survey in which 1025 randomly sampled adult Americans were asked, “How much time, if at all, do you personally spend using the Internet—more than 1 hour a day, up to 1 hour a day, a few times a week, a few times a mont
> Points scored in an NCAA basketball game
> In a national survey conducted by the Centers for Disease Control to determine health-risk behaviors among college students, college students were asked, “How often do you wear a seat belt when driving a car?” The frequencies were as follows: (a) Constru
> In a national survey conducted by the Centers for Disease Control to determine health-risk behaviors among college students, college students were asked, “How often do you wear a seat belt when riding in a car driven by someone else?” The frequencies wer
> A random sample of 2163 adults (aged 18 and over) was asked, “Given a choice of the following, which one would you most want to be?” The results of the survey are presented in the side-by-side bar graph. (a) What proportion of males would like to be rich
> A random sample of 2163 adults (aged 18 and over) was asked, “When you see an ad emphasizing that a product is ‘Made in America,’ are you more likely to buy it, less likely to buy it, or neither more nor less likely to buy it?” The results of the survey
> Identity fraud occurs when someone else’s personal information is used to open credit card accounts, apply for a job, receive benefits, and so on. The following relative frequency bar graph represents the various types of identity theft based on a study
> The following graph represents the results of a survey, in which a random sample of adult Americans was asked, “Please tell me whether you personally believe that in general divorce is morally acceptable or morally wrong.” (a) What percent of the respond
> The U.S. Census Bureau uses money income thresholds to define poverty. For example, in 2018 the poverty threshold for a family of four with two children was $25,100. The bar graph represents the number of people living in poverty (in thousands) in the Un
> The following Pareto chart shows the position played by the most valuable player (MVP) in the National League since 1931. Source:http://www.baseball-almanac.com/ (a) Which position had the most MVPs? (b) How many MVPs played first base (1B)? (c) How many
> Season The pie chart shown, the type we see in USA Today, depicts the approaches people use to avoid getting the flu. (a) What is the most common approach? What percentage of the population chooses this method? (b) What is the least used approach? What p
> This USA Today–type chart shows the top responses to the question, “Who’s the most difficult to ‘sell yourself’ to?” (a) What was the most common response? (b) The survey is of 1053 adults. How many stated their significant other is most difficult to “se
> Internet connection speed in kilobytes per second
> What is a bar graph? What is a Pareto chart?
> Observational studies are used to determine causality between an explanatory variable and response variable.
> A(n)_____design is one in which each experimental unit is randomly assigned to a treatment. A(n)____design is one in which the experimental units are paired up.
> Explain the difference between a single-blind and a double- blind experiment.
> What is replication in an experiment?
> Define the following: (a) Experimental unit (b) Treatment (c) Response variable (d) Factor (e) Placebo (f) Confounding (g) Blinding
> Treatments may be a combination of factors rather than a single factor. For example, suppose we want to investigate the role of diet and drugs in weight loss. Suppose we have three diet plans (a saturated-fat diet, the Mediterranean diet, or the U.S. Nat
> What is the role of randomization in a designed experiment? If you were conducting a completely randomized design with three treatments and 90 experimental units, describe how you would randomly assign the experimental units to the treatments.
> Research the link between the release of dopamine and the placebo effect.
> In May, 2020, the biotechnology company Novavax began human trials of its Covid-19 vaccine. The Phase I trial was a placebo-controlled, observer-blinded design. Most clinical trials go through five phases: Phase 0 (Pre-clinical), Phase I (Safety), Phase
> Number of Sequoia trees in a randomly selected acre of Yosemite National Park
> Match each word or phrase with its definition.
> Match each word or phrase with its definition.
> Time to complete the 500-meter race in speed skating.
> What is meant by the process of statistics?
> In October 2014, there was an Ebola breakout in West Africa. At the time, there was no vaccine for the virus, however, there were some experimental drugs that had not yet been approved for humans. Because the spread of the disease was reaching an epidemi
> List the four components that comprise the definition of statistics.
> A researcher believes that as age increases, the grip strength (pounds per square inch, psi) of an individual’s dominant hand decreases. From a random sample of 17 females, he obtains the following data. (a) Treating age as the explanatory variable, dete
> The following data represent the height (inches) of boys between the ages of 2 and 10 years. (a) Treating age as the explanatory variable, determine the estimates of /. What is the mean height of a 7-year-old boy? (b) Compute the standard error of the es
> Crickets make a chirping noise by sliding their wings rapidly over each other. Perhaps you have noticed that the number of chirps seems to increase with the temperature. The following table lists the temperature (in degrees Fahrenheit, °F) and the number
> State the requirements to perform inference on a simple least-squares regression line.
> Many municipalities are passing legislation that forbids smoking in restaurants and bars. Bar owners claim that these laws hurt their business. Are their concerns legitimate? The following data represent the smoking status and frequency of visits to bars
> The General Social Survey regularly asks individuals to disclose their religious affiliation. The following data represent the religious affiliation of young adults, aged 18 to 29, in the 1970s, 1980s, 1990s, and 2000s. Do the data suggest different prop
> The Harris Poll asked a random sample of adult Americans, “How important are moral values when deciding how to vote?” The results of the survey by disclosed political affiliation are shown in the table. (a) Do the sample data suggest that the proportion
> A researcher wanted to determine if the distribution of educational attainment of Americans today is different from the distribution in 2000. The distribution of educational attainment in 2000 was as follows: The researcher randomly selects 500 Americans
> A pit boss is concerned that a pair of dice being used in a craps game is not fair. The distribution of the expected sum of two fair dice is as follows: The pit boss rolls the dice 400 times and records the sum of the dice. The table shows the results. D
> In their book SuperFreakonomics, authors Steven Levitt and Stephen Dubner describe the research of behavioral economist John List. List recruited customers and dealers at a baseball-card show to participate in an experiment in which the customer would st

