Question: 1. How is SSM different from Deming’
1. How is SSM different from Deming’s PDCA cycle?
2. Prepare a cause-and-effect or fishbone diagram for a problem such as “Why customers have long waits for coffee.â€
Your fishbone diagram should be similar to that in Figure 7.17, using the main sources of cause: policy, procedure, people, and physical environment.
3. How would you resolve the difficulties that study teams have experienced when applying SSM?
Mega Bytes Restaurant8
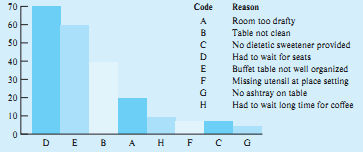
Mega Bytes is a restaurant that caters to business travelers and has a self-service breakfast buffet. To measure customer satisfaction, the manager constructs a survey and distributes it to diners during a three-month period. The results, as summarized by the Pareto chart in Figure 7.14, indicate that the restaurant’s major problem is customers waiting too long to be seated.
Figure 7.14: Pareto Chart of Complaints
A team of employees is formed to work on resolving this problem. The team members decide to use the Seven-Step Method (SSM), which is a structured approach to problem solving and process improvement originally developed by Joiner Associates, Inc., of Madison, Wisconsin. The SSM leads a team through a logical sequence of steps that forces a thorough analysis of the problem, its potential causes, and its possible solutions. The structure imposed by the SSM helps the team to focus on the correct issues and avoid diffusing its energy on tangential or counterproductive efforts. The SSM is directed at analytic rather than enumerative studies. In general, analytic studies are interested in cause and effect and in making predictions, whereas enumerative studies are focused on an existing population.
The steps in this method are shown in Table 7.4 and applied here to the case of Mega Bytes.
Table 7.4: The Seven-Step Method
Step 1: Define the Project
1. Define the problem in terms of a gap between what is and what should be. (For example, “Customers report an excessive number of errors. The team’s objective is to reduce the number of errors.â€)
2. Document why it is important to be working on this particular problem:
• Explain how you know it is a problem, providing any data you might have that support this.
• List the customer’s key quality characteristics. State how closing the gap will benefit the customer in terms of these characteristics.
3. Determine what data you will use to measure progress:
• Decide what data you will use to provide a baseline against which improvement can be measured.
• Develop any operational definitions you will need to collect the data.
Step 2: Study the Current Situation
1. Collect the baseline data and plot them. Sometimes historical data can be used for this purpose. A run chart or control chart usually is used to exhibit baseline data. Decide how you will these data on the run chart. Decide how you will label your axes.
2. Develop flowcharts of the processes.
3. Provide any helpful sketches or visual aids.
4. Identify any variables that might have a bearing on the problem. Consider the variables of what, where, to what extent, and who. Data will be gathered on these variables to localize the problem.
5. Design data collection instruments.
6. Collect the data and summarize what you have learned about the variables’ effects on the problem.
7. Determine what additional information would be helpful at this time. Repeat sub-steps through 7, until there is no additional information that would be helpful at this time.
Step 3: Analyze the Potential Causes
1. Determine potential causes of the current conditions:
• Use the data collected in step 2 and the experience of the people who work in the process to identify conditions that might lead to the problem.
• Construct cause-and-effect diagrams for these conditions of interest.
• Decide on most likely causes by checking against the data from step 2 and the experience of the people working in the process.
2. Determine if more data are needed. If so, repeat sub-steps 2 through 7 of step 2.
3. If possible, verify the causes through observation or by controlling variables directly.
Step 4: Implement a Solution
1. Develop a list of solutions to be considered. Be creative.
2. Decide which solutions should be tried:
• Carefully assess the feasibility of each solution, the likelihood of success, and potential adverse consequences.
• Clearly indicate why you are choosing a particular solution.
3. Determine how the preferred solution will be implemented. Will there be a pilot project? Who will be responsible for the implementation? Who will train those involved?
4. Implement the preferred solution.
Step 5: Check the Results
1. Determine whether the actions in step 4 were effective:
• Collect more data on the baseline measure from step 1.
• Collect other data related to the conditions at the start that might be relevant.
• Analyze the results. Determine whether the solution tested was effective. Prior-steps as necessary.
2. Describe any deviations from the plan and what was learned.
Step 6 Standardize the Improvement
1. Institutionalize the improvement:
• Develop a strategy for institutionalizing the improvement and assign responsibilities.
• Implement the strategy and check to see that it has been successful.
2. Determine whether the improvement should be applied elsewhere and plan for its implementation.
Step 7 Establish Future Plans
1. Determine your plans for the future:
• Decide if the gap should be narrowed further and, if so, how another project should be approached and who should be involved.
• Identify related problems that should be addressed.
2. Summarize what you learned about the project team experience and make recommendations for future project teams.
Step 1: Define the project. The results of the Mega Bytes survey indicate that customers wait too long to be seated. Most customers are business travelers who want to be served promptly or have an opportunity to discuss business during their meal. The team considers several questions such as “When does the wait start? When does it end? How is it measured?†and then arrives at an operational definition of the problem it must solve as “waiting to be seated.â€
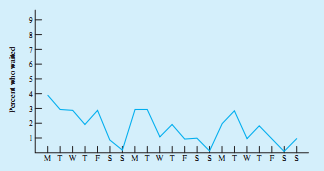
Step 2: Study the current situation. The team collects baseline data and plots them as shown in Figure 7.15. At the same time, a flowchart for seating a party is developed, and the team also diagrams the floor plan of Mega Bytes as shown in Figure 7.16.
Figure 7.15: Run Chart of Percent of Customers Waiting More Than One Minute to Be Seated

Figure 7.16: Restaurant Floor Plan
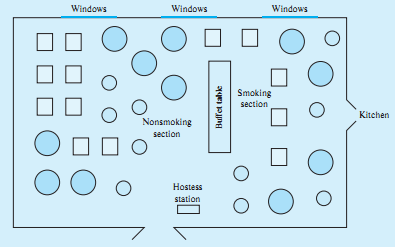
The baseline data indicate that the percentage of people who must wait is higher early in the week than it is late in the week. This finding is to be expected, however, because most Mega Bytes customers are business travelers. The size of the party does not appear to be a factor, and no surprises were found when a histogram of the number of people waiting in excess of one minute was plotted against the time of the morning: more people wait during the busy hours than during the slow hours.
The reason for the waiting, however, is interesting. Most people are kept waiting either because no table is available or no table in the area of their preference is available. Customers seldom have to wait because a host or hostess is not avail- able to seat them or others in their party have not yet arrived. At this point, it would be easy to jump to the conclusion that the problem could be solved just by adding more staff early in the week and during the busy hours.
The team members decide, however, that they need additional information on why these tables are not available and how seating preferences affect the waiting time. Subsequent data indicate that “unavailable†tables usually are unavailable because they need to be cleared, not because they are occupied by diners. The data also show that most people who wait have a preference for the nonsmoking section.
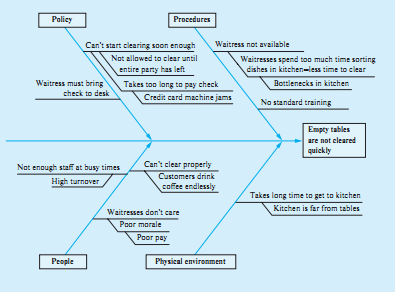
Step 3: Analyze the potential causes. A cause-and-effect diagram is constructed for “why tables are not cleared quickly,†as shown in Figure 7.17. The team concludes that the most likely cause of both problems (i.e., un-cleared tables and waiting for nonsmoking tables) can be attributed to the distance between the tables and the kitchen and, perhaps, to the current ratio of smoking-to-nonsmoking tables.
Figure 7.17: Cause-and-Effect Diagram Describing Why Tables Are Not Cleared Quickly
Step 4: Implement a solution. The team develops a list of possible solutions. Because the team cannot verify its conclusion by controlling variables, it chooses a solution that can be tested easily: set up temporary work stations in the nonsmoking area. No other changes are made, and data on the percentage of people now waiting longer than one minute to be seated are collected.
Step 5: Check the results. The team analyzes the results of data collected for one month in step 4 of the study. As Figure 7.18 shows, the improvement is dramatic.
Figure 7.18: Run Chart of Percent of Customers Waiting More Than One Minute to Be Seated after Implementation of Solution
Step 6: Standardize the improvement. The temporary work stations are replaced with permanent ones.
Step 7: Establish future plans. The team decides to address the next highest bar in the Pareto chart of customer complaints: that the buffet table is not well organized.
The authors of the article on which our Mega Bytes case is based report that managers who used SSM in various situations found the method’s focus and restraint to be valuable because it provided organization, logic, and thoroughness. The managers also were impressed with the method’s use of data instead of opinions, and they credited this factor with reducing territorial squabbles and promoting both cooperation and trust among team members.
While very valuable, SSM does entail some difficulties. For example, project teams have found several concepts in the first two steps very difficult to formulate. In particular, a team might have trouble developing a problem statement, because the tendency is to frame a solution as a problem. In the case of Mega Bytes, the team had to avoid identifying the problem as “There are too few servers,†“There aren’t enough tables,†or “The servers need to work faster.†The real problem was identified correctly as “The customers must wait too long.â€
Another concept that has been difficult for study teams is localization, which is a process of focusing on smaller and smaller vital pieces of the problem. This concept initially proved difficult because team members had not yet internalized the idea that improvement should be driven by customer requirements.
Some study teams have experienced an assortment of other difficulties. Occasionally, team members could not see the benefit of collecting data accurately, or they did not understand how baseline data would be used to validate a solution. Some members had trouble keeping an open mind and, consequently, resisted investigating the effects of variables they felt to be irrelevant. In some cases, members had to learn new skills, such as how to obtain information in a nonthreatening way from workers in the system. Finally, organizational problems such as arranging meeting times and getting support from coworkers had to be resolved as well.
Transcribed Image Text:
70 60 50 22 22 2 40 30 20 10 0 Code ABCDEFGH А с Reason Room too drafty Table not clean No dietetic sweetener provided Had to wait for seats Buffet table not well organized Missing utensil at place setting No ashtray on table Had to wait long time for coffee DEBAH F C G Percent who waited 160 054 M 2 M T W T F S S M T W T F S S M T W T F S S Day of week Windows O OO O O O O O O Windows O O Nonsmoking section Hostess station Buffet table Windows Smoking section O O оо O Kitchen Policy Waitress must bring check to desk Can't start clearing soon enough Not allowed to clear until entire party has left Not enough staff at busy times High turnover People Procedures Takes too long to pay check Waitress not available Credit card machine jams Can't clear properly Customers drink coffee endlessly Waitresses don't care Poor morale Poor pay Physical environment Waitresses spend too much time sorting \dishes in kitchen-less time to clear Bottlenecks in kitchen No standard training Empty tables are not cleared quickly Takes long time to get to kitchen Kitchen is far from tables Percent who waited ch MTWTFS S M T W T F S S MTWTFSS
> 1. The critical path for a project with uncertain activity times is not known for certain until after the project is completed. 2. A project can be defined as a set of complex interrelated tasks with different requirements regarding activity time and re
> 11. POS scanning is used to initiate a purchase order to a pre-approved vendor automatically when the stock levels are depleted (or reach a reorder point). 12. Information management has been the key in allowing services to meet customer demands without
> 21. World-class service operations strive to replace workers with enhanced automation. 22. Firms classified as "available for service" view quality improvement efforts with disdain. 23. For a firm achieving "journeyman" competitive status, the back-offic
> 1. Point-of-sale scanning became feasible only when industry agreed upon a universal system of bar coding. 2. One role of holding inventory is to hedge against anticipated increases in the cost of the inventoried items. 3. Inventory management is concern
> 11. Fast-food restaurants use a causal model to forecast daily demand for menu items. 12. Subjective models are used to assess the future impact of changing demographics. 13. Costs for preparing time-series forecasts generally are lower than for other mo
> 1. Because of the nontangible nature of a service, forecasting does not play as important a role in service operations as in manufacturing operations. 2. The trade-off to be made with respect to accuracy is between the costs of inaccurate forecasts and t
> 14. When Xerox Corporation introduced the Model 9200 Duplicating System, the level of service dipped because technical representatives were assigned to territories. 15. The average time a customer should expect to wait can be calculated using just the me
> 1. Capacity planning decisions deal implicitly with decisions on the cost of making consumers wait and the extent to which these costs can be borne. 2. A system is said to be in a transient state when the values of its governing parameters in this state
> 1. Waiting is often seen as psychological punishment because the consumer is aware of the opportunity cost of waiting time and the resulting loss of earnings. 2. The net result of waiting, apart from the boredom and frustration experienced by the consume
> 12. Yield management is a pricing and capacity allocation system that was developed by American Airlines. 13. Yield management is a strategy that manages both demand and capacity. 14. An example of segmenting demand is seen when movie theaters offer mati
> 1. The use of a ski-resort hotel for business conventions during the summer is an example of using the complementary service strategy. 2. Overbooking is a strategy that can be used to smooth demand. 3. The strategy of segmenting demand to reduce variatio
> 11. A diversified network is a situation where many services are offered at a single location. 12. Franchising usually is used when developing a focused network. 13. A family restaurant is an example of a focused service. 14. Communication is included in
> 1. Network development is a consideration in the decision to plan a multinational service. 2. When a firm offers multiple services at a single location, it is using a clustered service strategy. 3. A franchise is a low risk investment, because the franch
> 14. Retail and wholesale trade had the greatest percentage of U.S. employment by industry in 2014. 15. From a marketing perspective, services, unlike goods, involve transfer of ownership. 16. It is convenient and often necessary to combine the operations
> 14. Customer-supplier duality acknowledges the customer inputs in a service relationship. 15. A bank is an example of a service provider with a single-level bi-directional service supply relationship. 16. Transfer enhances productive capacity by enabling
> 1. In the physical goods supply chain, information moves to the left and material to the right. 2. Customer demand variability is the most difficult factor to determine in a goods supply chain. 3. In the past, the flow of goods in a physical supply chain
> 11. Geographic information systems are a visual method of displaying data. 12. Cross-median is an approach to the location of a single facility using the metropolitan metric to maximize the total distance traveled. 13. Marketing intermediaries are busin
> 1. Finding a unique set of sites in a multi-location problem is a simple extension of the methods used for single facility location. 2. When a customer travels to the service facility, the direct cost that is incurred is the decrease in potential custome
> 1. DEA circumvents the need to develop standard costs for each service when comparing the efficiency of multiple service units that provide similar services. 2. Data envelopment analysis (DEA) is best used in an environment of low divergence and high com
> 11. Serving complimentary drinks on a delayed flight is an example of empathy being shown by the service personnel to the irate customer. 12. In the service quality gap model, GAP1 arises because of the management’s lack of understanding about how custom
> 1. The concept of quality service deployment is based on the belief that services should be designed to reflect customer requirements. 2. Being meaningful and easy to invoke are important elements of a good unconditional service guarantee. 3. A process i
> 14. The procedure to improve flow distance in a process layout by arranging the relative location of departments is known as operations sequence analysis. 15. A product layout affords some degree of customization. 16. Mid-Columbia Medical Center has a sp
> 1. The servicescape can influence perceived quality. 2. The design of facilities is dependent entirely on the construction and operating costs of the facilities. 3. A well-conceived servicescape can communicate desired customer behavior. 4. Heuristic alg
> 14. Internet banking is a service that would appeal to the economizing customer, the personalizing customer, and the convenience customer. 15. Efficiency- versus-satisfaction is the possible source of conflict in the relationship between the customer and
> 1. Services are deeds, processes, and performances. 2. The Clark-Fisher hypothesis notes the shift of employment from one sector of the economy to another. 3. The fall in employment in the agricultural sector is the primary reason for the increase in se
> 1. Who are Goodwill’s customers and how have their demo-graphics changed over time? 2. How should the introduction of for-profit thrifts affect Goodwill’s decisions about the role of customer service? 3. How can Goodwi
> 1. Marketing analysts use market position maps to display visually the customers’ perceptions of a firm in relation to its competitors regarding two attributes. Prepare a market position map for Alamo Draft house using “food quality” and “movie selection
> 1. For the Burger Palace example, perform a complete analysis of efficiency improvement alternatives for unit S2, including determination of a composite reference unit. 2. For the Burger Palace example, perform a complete analysis of efficiency improveme
> 1. Compare and contrast the strategic service vision of El Banco and United Commercial Bank. 2. Identify the service winners, qualifiers, and service losers for El Banco and United Commercial Bank. 3. What are the differentiating features of banks tha
> 1. Use DEA to identify efficient and inefficient terminal operations. Formulate the problem as a linear programming model, and solve using computer software such as Excel Solver that permits input file editing between runs. 2. Using the appropriate refer
> 1. Assume that you are part of the management staff whose task is to develop this sketch plan. Using Microsoft Project, develop the PERT network as outlined above, identify the critical path, and determine the expected time to reach basic operational sta
> 1. Using Microsoft Project, prepare a network and identify the critical path activities, the expected project duration, and scheduling times for all activities. 2. The elapsed time for delivery of the hardware is estimated at 90 days. Would the project c
> Located in a major southwestern U.S. city, Elysian Cycles (EC) is a wholesale distributor of bicycles and bicycle parts. Its primary retail outlets are located in eight cities within a 400-mile radius of the distribution center. These retail outlets gene
> 1. Assuming that the cost of stock out is the lost contribution of one dessert, how many portions of Sweet Revenge should the chef prepare each weekday? 2. Based on Martin Quinn’s estimate of other stock out costs, how many servings sho
> A.D. Small, Inc., provides management consulting services from its offices located in more than 300 cities in the United States and abroad. The company recruits its staff from top graduates of recognized MBA programs. Upon joining A.D. Small, a recruit a
> Gnomial Functions, Inc. (GFI), is a medium-sized consulting firm in San Francisco that specializes in developing various forecasts of product demand, sales, consumption, or other information for its clients. To a lesser degree, it also has developed ongo
> Oak Hollow Medical Evaluation Center is a nonprofit agency offering multidisciplinary diagnostic services to study children with disabilities or developmental delays. The center can test each patient for physical, psychological, or social problems. Fees
> Computer simulation provides management an experimental laboratory in which to study a model of a real system and to determine how the system might respond to changes in policies, resource levels, or customer demand. A system, for our purposes, is define
> 1. Describe Xpresso Lube’s service package. 2. How are the distinctive characteristics of a service operation illustrated by Xpresso Lube? 3. What elements of Xpresso Lube’s location contribute to its success? 4. Given the example of Xpresso Lube, what o
> On a hillside in Rolling wood, a community just southwest of Austin, Texas, the Renaissance Clinic provides dedicated obstetric and gynecological services. The medical treatment at this facility is wrapped in an exclusive-feeling physical environment tha
> Let us revisit the Automobile Driver’s License Office Example 5.2 and model the proposed process improvement shown as Figure 5.6 (b). Recall that the improvement consisted of combining activities 1 and 4 (Review Application and Eye Test
> Renaissance Clinic is a hospital dedicated to the health care of women. It is located in the hill country surrounding Austin, Texas, and offers an environment that is unique in the city. At the time of a visit, a patient of Dr. Margaret Thompsonâ&#
> 1. During periods of bad weather, as compared with periods of clear weather, how many additional gallons of fuel on aver-age should FreeEx expect its planes to consume because of airport congestion? 2. Given FreeEx’s policy of ensuring that its planes do
> The Houston Port Authority has engaged you as a consultant to advise it on possible changes in the handling of wheat exports. At present, a crew of dockworkers using conventional belt conveyors unloads hopper cars containing wheat into cargo ships bound
> Go forth armed with clipboard and stopwatch and study an actual waiting experience (e.g., post office, fast-food restaurant, retail bank). Begin with a sketch of the layout noting the queue configuration. Describe the characteristics of the calling popul
> 1. In this chapter, we referred to Maister’s First and Second Laws of Service. How do they relate to this case? 2. What features of a good waiting process are evident in Dr. X’s practice? List the shortcomings that you see. 3. Do you think that Mrs. F is
> Thrifty Car Rental (now part of Hertz) began as a regional business in the southwest, but it now has more than 470 locations across the country and almost 600 international locations. About 80 percent of its U.S. locations are at airports, and the rest a
> 1. For the forecast period (i.e., July–December), determine the number of new trainees who must be hired at the beginning of each month so that total personnel costs for the flight-attendant staff and training program are minimized. For
> On the morning of November 10, 2002, Jon Thomas, market analyst for the Mexico leisure markets, canceled more than 300 seats “illegally” reserved on two flights to Acapulco. All of the seats on Jon’s Acapulco flights were booked by the same sales represe
> 1. Assume that you are the assistant to the manager for operations at the FAA. Use the techniques of work shift scheduling to analyze the total workforce requirements and days-off schedule. For the primary analysis, assume that a. Operator requirements w
> River City National Bank has been in business for 10 years and is a fast-growing community bank. Its president, Gary Miller, took over his position 5 years ago in an effort to get the bank on its feet. He is one of the youngest bank presidents in the sou
> Securing a mortgage often is a time-consuming and frustrating experience for a homebuyer. The process involves multi- ple stages with many handoffs to independent organizations providing specialized services (e.g., property survey and title search). The
> 1. What features of the 7-Eleven Japan distribution system illustrate the concept of the bidirectional service supply relationship? 2. Does the 7-Eleven Japan distribution system exhibit scalability economies? 3. How does the 7-Eleven example of B2C e-co
> 1. How does the Boomer Technology Circle illustrate the concept of the bidirectional service supply relationship? 2. How has Boomer Consulting, Inc., made the client a coproduce in the service delivery process? 3. How is the concept of “
> 1. Utilizing a spreadsheet version of the Huff location model (with λ = 1.0), recommend a store size and location for AFI. Assuming that AFI does not wish to consider a store that is smaller than 10,000 square feet, assess the store sizes (b
> Joan Taylor, the administrator of Life-Time Insurance Company, which is based in Buffalo, New York, was charged with establishing a health maintenance organization (HMO) satellite clinic in Austin, Texas. The HMO concept would offer Austin residents an a
> 1. Briefly summarize the complaints and compliments in Dr. Loflin’s letter. 2. Critique the letter of Gail Pearson in reply to Dr. Loflin. What are the strengths and weaknesses of the letter? 3. Prepare an “improved” response letter from Gail Pearson. 4.
> 1. Prepare an -chart and R-chart for complaints, and plot the average complaints for each crew during the nine-month period. Do the same for the performance ratings. What does this analysis reveal about the service quality of CSI’s
> 1. Describe Village Volvo’s service package. 2. How are the distinctive characteristics of a service firm illustrated by Village Volvo? 3. How could Village Volvo manage its back office (i.e., repair operations) like a factory? 4. How can Village Volvo d
> 1. How do the environmental dimensions of the services cape explain the success of Central Market? 2. Comment on how the services cape shapes the behaviors of both customers and employees. Central Market5 The original Central Market grocery store, locat
> 1. Use CRAFT logic to develop a layout that will maximize customer time in the store. 2. What percentage increase in customer time spent in the store is achieved by the proposed layout? 3. What other consumer behavior concepts should be considered in the
> 1. Identify the bottleneck activity, and show how capacity can be increased by using only two pharmacists and two technicians. 2. In addition to savings on personnel costs, what benefits does this arrangement have? Health Maintenance Organization (B) Th
> 1. Beginning with a good initial layout, use operations sequence analysis to determine a better layout that would minimize the walking distance between different areas in the clinic. 2. Defend your final layout based on features other than minimizing wal
> 1. How has Enterprise Rent-A-Car (ERAC) defined its service differently than that of the typical national car rental company? 2. What features of its business concept allow ERAC to compete effectively with the existing national rental car companies? 3. U
> 1. Describe the service organization culture at Amy’s Ice Cream. 2. What are the personality attributes of the employees who are sought by Amy’s Ice Cream? 3. Design a personnel selection procedure for Amy’s Ice Cream using abstract questioning, a situat
> 1.How does Amazon.com illustrate the sources of service sector growth? Comment on information technology, the Internet as an enabler, innovation, and changing demographics. 2.What generic approach(s) to service design does Amazon.com illustrate, and what
> 1. Prepare a service blueprint for Commuter Cleaning. 2. What generic approach to service system design is illustrated by Commuter Cleaning, and what competitive advantages does this design offer? 3. Using the data in Table 3.5, calculate a break-eve
> 1. Describe the growth strategy of Federal Express. How did this strategy differ from those of its competitors? 2. What risks were involved in the acquisition of Tiger International? 3. In addition to the question of merging FedEx and Flying Tigers pilot
> 1. Prepare a service blueprint for the 100 Yen Sushi House operation. 2. What features of the 100 Yen Sushi House service delivery system differentiate it from the competition, and what competitive advantages do they offer? 3. How has the 100 Yen Sushi
> 1. Prepare a run chart on each of the incident categories. Does she have reason to be concerned about burglaries? What variable might you plot against burglaries to create a scatter diagram to determine a possible explanation? 2. What is unusual about th
> Conduct a Google search on “project finance” and find employment opportunities in project finance. What is the role of finance in projects?
> Could firms in the “world-class service delivery” stage of competitiveness be described as “learning organizations’?
> Discuss the difference between time variance, cost variance, and schedule variance.
> Explain why the PERT estimate of expected project duration always is optimistic. Can we get any feel for the magnitude of this bias?
> Are Gantt charts still viable project management tools? Explain.
> Illustrate the four stages of team building from your own experience.
> Give an example that demonstrates the trade-off inherent in projects among cost, time, and performance.
> Identify dependent and independent demand for an airline and a hospital.
> Service capacity (i.e., seats on an aircraft) has characteristics similar to inventories. What inventory model would apply?
> How is a service level determined for most inventory items?
> How valid are the assumptions for the simple EOQ model?
> Discuss how information technology can help to create a competitive advantage through inventory management?
> Determine if the U.S. service sector currently is expanding or contracting based upon the Non-Manufacturing Index (NMI) found at ISM Report on Business on the Institute of Supply Management website: http://www.ism.ws/pubs/ismmag/.
> Compare and contrast a continuous review inventory system with a periodic review inventory system?
> How would one find values for inventory management costs?
> Discuss the functions of inventory for different organizations in the supply chain (i.e., manufacturing, suppliers, distributors, and retailers).
> What changes in (, (, and ( would you recommend to improve the performance of the trendline seasonal adjustment forecast shown in Figure 11.4? Figure 11.4: Profile of Operator Requirements and Tour Assignments Number of operators 25 20 15 10 5 0 12
> Why is the N-period moving-average model still in common use if the simple exponential smoothing model has superior qualities?
> Suggest a number of independent variables for a regression model to predict the potential sales volume of a given location for a retail store (e.g., a video rental store).
> The number of customers at a bank likely will vary by the hour of the day and by the day of the month. What are the implications of this for choosing a forecasting model?
> For each of the three forecasting methods (i.e., time series, causal, and subjective), what costs are associated with the development and use of the forecast model? What costs are associated with forecast error?
> What characteristics of service organizations make forecast accuracy important?
> Discuss how the M/G/( model could be used to determine the number of emergency medical vehicles that are required to serve a community.
> Give an example of a firm that began as world-class and has remained in that category.
> What are some disadvantages associated with the concept of pooling service resources?
> For a queuing system with a finite queue, the arrival rate can exceed the capacity to serve. Use an example to explain how this is feasible.
> Example 13.1 presents a naïve capacity planning exercise and was criticized for using averages. Recall the concept of a "bottleneck" from Chapter 5, "Supporting Facility and Process Flows," and suggest other reservations about this planning exercise.
> Discuss how one could determine the economic cost of keeping customers waiting.
> When the line becomes long at some fast-food restaurants, an employee will walk along the line taking orders. What are the benefits of this policy?
> Suggest ways that service management can influence the arrival times of customers.

