Question: Consider the assembly of three components shown
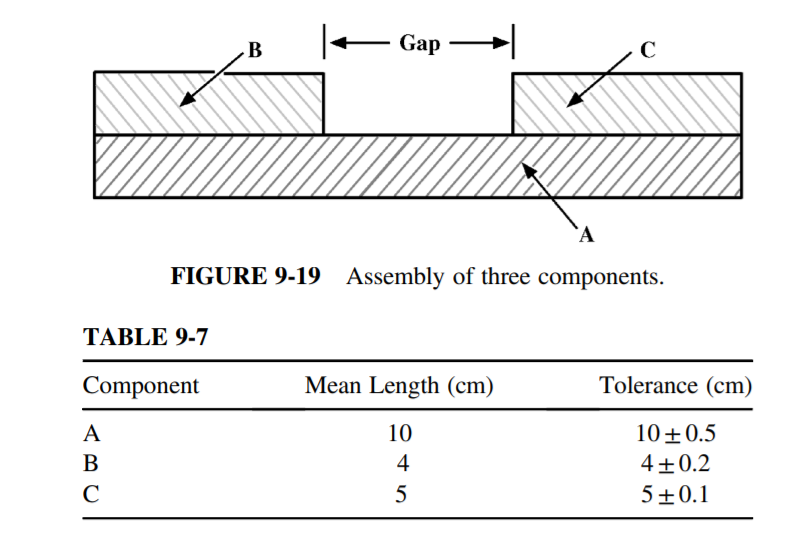
Consider the assembly of three components shown in Figure 9-19. The tolerances for these three components are given in Table 9-7. Assume that the tolerances on the components are independent of each other and that the lengths of the components are normally distributed with a capability ratio of 1. What is the tolerance of the gap? Assuming normality, if specifications for the gap are 0.9± 0.201 cm, what proportion of the assemblies will not meet specifications? How could the proportion of nonconforming assemblies be reduced?
> Meeting customer due dates is an important goal. What attribute or variables control charts would you select to monitor? Discuss the underlying assumptions in each case.
> Distinguish between 3σ limits and probability limits. When would you consider constructing probability limits?
> A quality improvement program has been instituted in an organization to reduce total quality costs. Discuss the impact of such a program on prevention, appraisal, and failure costs.
> Explain why a p- or c-chart is not appropriate for highly conforming processes.
> Explain the conditions under which a u-chart would be used instead of a c-chart.
> Discuss the impact of the control limits on the average run length and the operating characteristic curve.
> Distinguish between a nonconformity and a nonconforming item. Give examples of each in the following contexts: (a) Financial institution (b) Hospital (c) Microelectronics manufacturing (d) Law firm (e) Non-profit organization
> A new hire has been made in a management consulting firm and data are monitored on response time to customer queries. Discuss what the patterns on an and R-chart might look like as learning on the job takes place.
> Explain the difference in interpretation between an observation falling below the lower control limit on an and one falling below the lower control limit on an R-chart. Discuss the impact of each on the revision of control charts in the con
> Patient progress in a health care facility is monitored over time for a certain diagnosis related group according to a few vital characteristics (systolic blood pressure, diastolic blood pressure, total cholesterol, weight). The characteristics, however,
> A start-up company promoting the development of new products can afford only a few observations from each product. Thus, a critical quality characteristic is selected for monitoring from each product. What type of control chart would be suitable in this
> What are some considerations in the interpretation of control charts based on standard values? Is it possible for a process to be in control when its control chart is based on observations from the process but to be out of control when the control chart
> Discuss specific characteristics that could be monitored through variable control charts, the form of data to collect, and the appropriate control chart in the following situations: (a) Waiting time to check in baggage at an airport counter (b) Product a
> An intermodal logistics company uses trucks, trains, and ships to distribute goods to various locations. What might be the various quality costs in each of the categories of prevention, appraisal, internal failure, and external failure?
> Discuss the preliminary decisions that must be made before you construct a control chart. What concepts should be followed when selecting rational samples?
> Describe the use of the Pareto concept in the selection of characteristics for control charts.
> Lung congestion may occur in illness among infants. However, it is not easily verifiable without radiography. To monitor an ill infant to predict whether lung opacity will occur on a radiograph, data are kept on age, respiration rate, heart rate, tempera
> What is the motivation behind constructing multivariate control charts? What advantages do they have over control charts for individual characteristics?
> Discuss the appropriate setting for using a modified control chart and an acceptance control chart. Compare and contrast the two charts.
> Discuss the importance of risk adjustment in monitoring mortality and related measures in a health care setting.
> What are the conditions under which a moving-average control chart is preferable? Compare the moving-average chart with the geometric moving-average chart.
> What are the advantages and disadvantages of cumulative sum charts compared to Shewhart control charts?
> Explain the concept of process capability and when it should be estimated. What is its impact on non-conformance? Discuss in the context of project completion time of the construction of an office building.
> An optical sensor has a Weibull time-to-failure distribution with a scale parameter of 300 hours and a shape parameter of 0.5. What is the reliability of the sensor after 500 hours of operation? Find the mean time to failure.
> Control charts are maintained on individual values on patient recovery time for a certain diagnosis-related group. What precautions should be taken in using such charts and what are the assumptions?
> An OEM in the automobile industry is considering an improvement in its order processing system with its tier 1 suppliers. Discuss appropriate measures of quality. What are some special and some common causes in this environment?
> An electronic component in a video recorder has an exponential time-to-failure distribution. What is the minimum mean time to failure of the component if it is to have a probability of 0.92 of successful operation after 6000 hours of operation?
> A transistor has an exponential time-to-failure distribution with a constant failure rate of 0.00006/hour. Find the reliability of the transistor after 4000 hours of operation. What is the mean time to failure? If the repair rate is 0.004/hour, find the
> Refer to Exercise 9-33 on the order completion time of a logistics firm. Upon conducting a methods study of the various operations, the firm was able to reduce the mean times of operation 1 to 5.8 hours and that of operation 3 to 7.5 hours. Assume that t
> Refer to Exercise 9-39. Find the sample size needed to construct a one-sided lower nonparametric statistical tolerance limit. It should contain 90% of the population with a probability of 0.95. How will the limit be found? Data from Exercise 9-39: Find
> Find the sample size required for two-sided nonparametric statistical tolerance limits for the viscosity of a grease used as a lubricant. It should contain 99% of the population with a probability of 0.95. How will the interval be found?
> The body mass index (BMI) is a measure of obesity and equals a person’s weight (in kilograms) divided by the height (in meters) squared. For a certain diagnosis related group of 20 patients, the following natural tolerances were obtained on weight (60± 5
> In solar cells, the exposed surface area is the characteristic of interest. The tolerances on the length and width of the cells are 4 ±0.06 cm and 5± 0.09 cm, respectively. Assuming these dimensions to be independent of each other and each normally distr
> A cylindrical piece is used in an assembly in which the weight is to be controlled. The tolerances on diameter and height, on the basis of five observations, are 2 ±0.06 cm and 6 ±0.06 cm, respectively. Assume that the dimensions are independent of each
> Consider the data on call waiting time of customers in a call center. The call center has set a goal of waiting time not to exceed 35 seconds. (a) Test to see (using α =0.05) if conducting capability analysis using normal distribution is appropriate. (b)
> Measurements on the pH values of a chemical compound are taken at random by two operators. Fifteen samples are randomly chosen, with each operator measuring each sample twice. The data are shown in Table 9-10. Specifications on pH are 6.5 ±
> A financial institution wants to improve proposal preparation time for its clients. Discuss the actions to be taken in reducing the average preparation time and the variability of preparation times.
> A logistics firm has identified four operations, which are to be conducted in succession, for an order to be processed. The tolerances (in hours) are shown in Table 9-9. Assume that the tolerances are independent of each other and that the time in each p
> In a piston assembly, the specifications for the piston diameter are 12 ±0.5 cm, and those for the cylinder diameter are 12.10 ±0.4 cm. Assume that the natural tolerance limits coincide with the specifications. A clearance fit is required for the assembl
> Refer to Exercise 9-30. If there is too much clearance between the hole and the shaft, a wobble will result. Clearances above 0.05 cm are not desirable and cause a wobble. Find the probability of a wobble. Data from Exercise 9-30: The specifications for
> The specifications for a shaft diameter in an assembly are 5± 0.03 cm, and those for the hole are 5.25 ±0.08 cm. If the assembly is to have a clearance of 0.18 ±0.05 cm, what proportion of the assemblies will be acceptable?
> Consider Figure 9-16, which shows the assembly of a shaft in a bearing. The specifications for the shaft diameter are 6± 0.06 cm, and those for the hole diameter are 6.2± 0.03 cm. (a) Find the probability of the assembly havin
> Four metal plates, each of thickness of 3 cm, are welded together to form a subassembly. The specifications for the thickness of each plate are 3± 0.2 cm. Assuming the weld thickness to be negligible, determine the tolerances for the assembly thickness.
> Consider the two-component assembly shown in Figure 9-15. Suppose that the mean lengths are given as μ1=14 cm and μ2=8 cm. Assuming that the specifications for Y are 6± 0.2 cm, what are the tolerances for X1 and
> Consider the two-component assembly shown in Figure 9-15. Suppose that the specifications for the dimension X2 are 5 ±0.05 cm and those for X1 are 12± 0.15 cm. Find the specifications for the dimension Y. Assume that the speci
> Refer to Exercise 9-24. Suppose that the specifications for the assembly length are 35± 0.3 cm and that the tolerances of A and C are equal but those for B and D are each twice as large as that for A. In addition, assume that the specificat
> Refer to the four-component assembly shown in Figure 9-14. Assume that the length of each component is normally and independently distributed with the means shown in Table 9-8. The specifications for the assembly length are 35 ±0.5 cm. Assu
> What are the advantages and disadvantages of using variables rather than attributes in control charts?
> In Exercise 9-22, suppose that the specifications for the gap are 1.05± 0.15 cm. An assembly with a gap exceeding the upper specification limit is scrapped, whereas that with a gap less than the lower specification limit can be reworked to
> The amount of a preservative added to dairy products should not exceed certain levels of 23 ±6 mg (set by the Food and Drug Administration). Samples of size 5 of processed cheese produced the values of the average and range shown in Table 9
> The waiting time in minutes before being served in a local post office is observed for 50 randomly chosen customers: (a) Test for normality using α= 0.05. What inferences can you draw? (b) Estimate the mean and standard deviation of the wai
> The diameter of a forged part has specifications of 120± 5 mm. A sample of 25 parts chosen from the process gives a sample mean of 122 mm with a sample standard deviation of 2 mm. (a) Find the Cpk index for the process and comment on its value. What is t
> Refer to Exercise 9-13. Find the process capability index Cpk and comment on process performance. If the target value is 47.5 ppm, find the Cpm and Cpmk indices and comment on their values. If the process center is shifted to the midpoint between the spe
> The emergency service unit in a hospital has a goal of 3.5 minutes for the waiting time of patients before being treated. A random sample of 20 patients is chosen and the sample average waiting time is found to be 2.3 minutes with a sample standard devia
> For Exercise 9-13, find the Cp index. Comment on the ability of the process to meet specifications. What proportion of the specification range is used up by the process? If it is easier to change the process mean than to change its variability, to what v
> How are rational samples selected? Explain the importance of this in the total quality systems approach.
> A pharmaceutical company producing vitamin capsules desires a proportion of calcium content between 40 and 55 ppm. A random sample of 20 capsules chosen from the output yields a sample mean calcium content of 44 ppm with a standard deviation of 3 ppm. Fi
> The marketing department of a large organization is interested in being responsive to its customers’ needs. Accordingly, each week it monitors the number of complaints received. It is possible for a customer to have more than one compla
> A major airline surveys passengers to monitor the satisfaction level of its customers. Even though the airline uses a five-point Likert scale (5: outstanding service; 4: good; 3: average; 2: below average; 1: poor), it wants to monitor the proportion tha
> An organization that accepts orders via the Web, processes it, and has delivery scheduled based on its inventory levels is known to be proficient in its service. Errors in orders received could be due to wrong shipment of product, incorrect quantity, or
> Data from a city bank showing monthly loan applications for home mortgage and the number rejected are given in Table 8-36. Construct an appropriate control chart and comment on the loan approval process.
> In a health care facility, it is known that nosocomial infections are rare. Table 8-35 shows the number of admissions between occurrences of nosocomial infections. Construct an appropriate control chart and comment on the performance of the health care t
> Mortality data for patients in the intensive care unit (ICU) in a health care facility, collected over 8-hour intervals, are shown in Table 8-34. Since patients have varying risks, the predicted mortality from a logistic regression model that uses the pa
> The JCAHO has standards pertaining to patient restraint use. A checklist has been developed that is to be used each time a restraint is used. The checklist contains five items, all of which should be checked. Table 8-33 shows data collected for 25 months
> Consider Exercise 8-38. However, now assume that the interval between complications follows an exponential distribution. Construct an appropriate control chart and comment on the process assuming a type I error rate of 0.005. Data from Exercise 8-38: Th
> Consider Exercise 8-38 under the assumption that the complication rate is 0.1% and a type I error of 0. 005.If you reduced the upper control limit to half of its previous value, what type of process complication rates, on average, will this new limit be
> Discuss the relationship between ARL and type I and II errors.
> Consider Exercise 8-38. Determine the sensitivity of the control limits complication rate using values of 0.2% and 0.5%. Data from Exercise 8-38: The number of heart surgery complications is rare. To monitor the effectiveness of such surgeries, data are
> Consider Exercise 8-38 under the assumption that the complication rate is 0.1%. If you were to construct a p-chart using two-sided 3σ limits, what would the minimum sample size be to detect an improvement in the process? Data from Exercise 8-
> Consider Exercise 8-38. If you were interested in detecting an improvement in the process using a one-sided limit, what should the minimum sample size be for an α of 0.005? What should it be for an α of 0.05? What conclusions
> The number of heart surgery complications is rare. To monitor the effectiveness of such surgeries, data are recorded on the number of such procedures until a complication occurs. These complications occur independently with a constant probability of occu
> Refer to Exercise 8-36. Set up 2σ control limits. What is the probability of detecting a change in the process average number of dietary errors per 100 trays to 8 on the first sample drawn after the change? Explain under what conditions you wo
> Refer to Exercise 8-27. Construct an OC curve for the c-chart. If the process average number of dietary errors per 100 trays increases to 10, what is the probability of detecting this on the first sample drawn after the change? Data from Exercise 8-27:
> Refer to Exercise 8-18. Construct an OC curve for the p-chart. If the process proportion of dissatisfied customers were to rise to 7%, what is the probability of not detecting this shift on the first sample drawn after the change has taken place? What is
> The Joint Commission on Accreditation of Healthcare Organizations (JCAHO) requires an accounting of significant medication errors. Data collected over the last 25 months, shown in Table 8-31, indicate the number of orders filled and the number of signifi
> Refer to Exercise 8-32. If the weighting systems were different (i.e., 10, 5, and 1), how would the centreline and the control limits change for the U-chart? Discuss changes, if any, in the inferences made about the process. Data from Exercise 8-32: Non
> Nonconformities in automobiles fall into three categories: serious, major, and minor. Twenty-five samples of five automobiles are chosen, and the total number of nonconformities in each category is reported. Table 8-30 shows the results. Assuming a weigh
> Describe the role of the average run length (ARL) in the selection of control chart parameters. Explain how ARL influences sample size.
> The director of a pharmacy department is interested in benchmarking the level of operations in the unit. The director has defined medication errors as being any one of the following: wrong medication; wrong dose; administered to the wrong patient; admini
> Refer to Exercise 8-29. If we want to control the number of imperfections per 100 m2, how would this affect the control chart? What would the control limits be? In terms of decision making, would there be a difference between this problem and Exercise 8-
> The number of imperfections in bond paper produced by a paper mill is observed over a period of several days. Table 8-28 shows the area inspected and the number of imperfections for 25 samples. Construct a control chart for the number of imperfections pe
> A building contractor subcontracts to a local merchant a job involving hanging wallpaper. To have an idea of the quality level of the merchant’s work, the contractor randomly selects 300 m2 and counts the number of blemishes. The total number of blemishe
> The number of dietary errors is found from a random sample of 100 trays chosen on a daily basis in a health care facility. The data for 25 such samples are shown in Table 8-27. (a) Construct an appropriate control chart and comment on the process. (b) Ho
> The number of processing errors per 100 purchase orders is monitored by a company with the objective of eliminating such errors totally. Table 8-26 shows samples that were selected randomly from all purchase orders. The company is in the process of testi
> Refer to Exercise 8-18 and the data shown in Table 8-21. Construct a control chart for the number of dissatisfied customers. Revise the chart, assuming special causes for points outside the control limits. Data from Exercise 8-18: The number of customer
> A health care facility is interested in monitoring the primary C-section rate. Monthly data on the number of primary C-sections collected over the last two and a half years is shown in Table 8-25. (a) Is the process in control? (b) There is pressure to m
> The quality of service in a hospital is tracked by determining the proportion of medication errors; this is done by dividing the number of medication errors by 1000 patient-days for each observation. The results of 25 such samples (in percentage of medic
> What is the utility of the operating characteristic curve? How can the discriminatory power of the curve be improved?
> Observations are taken from the output of a company making semiconductors. Table 8-23 shows the sample size and the number of nonconforming semiconductors for each sample. Construct a p-chart by setting up the exact control limits for each sample. Are an
> Health care facilities must conform to certain standards in submitting bills to Medicare/Medicaid for processing. The number of bills with errors and the number sampled are shown in Table 8-22. Construct an appropriate control chart and comment on the pe
> Refer to Exercise 8-18. Management believes that the dissatisfaction rate is 3%, so establish control limits based on this value. Comment on the ability of the store to meet this standard. If management were to set the standard at 2%, can the store meet
> The number of customers who are not satisfied with the service provided in a retail store is found for 20 samples of size 100 and is shown in Table 8-21. Construct a control chart for the proportion of dissatisfied customers. Revise the control limits, a
> Every employee in a check-processing department goes through a four-month training period, after which the employee is responsible for their operation. The work of one employee who has been on the job for eight months is being studied. Table 8-20 shows t
> For the patient data in Exercise 7-52 as shown in Table 7-32, construct a risk-adjusted exponentially weighted moving average (RAEWMA) chart using a weighting constant of 0.2 and a false-alarm rate of 0.10. Comment on the performance of the surgical team
> Refer to Exercise 7-52 and the data in Table 7-32 on cardiac surgery patients. Conduct a risk-adjusted sequential probability ratio test using a false-alarm rate of 0.005. Assume that the chance of failing to detect a decrease in the odds ratio of mortal
> The predicted mortality of cardiac surgery patients in an intensive care unit, based on their APACHE score, is found based on a logistic regression model applied to patients over a four-year period. Table 7-32 shows the predictive pre-operative mortality
> Refer to Exercise 7-49. Construct an exponentially weighted moving-average chart using a weighting constant of 0.2 for the weekly amount invested. Comment on the process. If it is desired to have a goal value of $1.5M for the standard deviation, using th
> Refer to Exercise 7-49 and the revised process. Is this process capable of meeting a goal value of $1.5M for the standard deviation of the weekly amount invested? Construct an appropriate chart and discuss. Data from Exercise 7-49: An investment bank is
> What are warning limits and what purpose do they serve?
> An investment bank is interested in monitoring the weekly amount (in millions of dollars) invested in volatile stocks so as to maintain a stable rate of return on a selected fund. Table 7-31 shows 25 consecutive weeks of the amount invested ($M) in the f

