Question: Transistor gain between emitter and collector in
Transistor gain between emitter and collector in an integrated circuit device (hFE) is related to two variables (Myers, Montgomery and Anderson-Cook, 2009) that can be controlled at the deposition process, emitter drive-in time (x1, in minutes) and emitter dose (x2, in ions × 1014). Fourteen samples were observed following deposition, and the resulting data are shown in the table below. We will consider linear regression models using gain as the response and emitter drive-in time or emitter dose as the regressor variable.
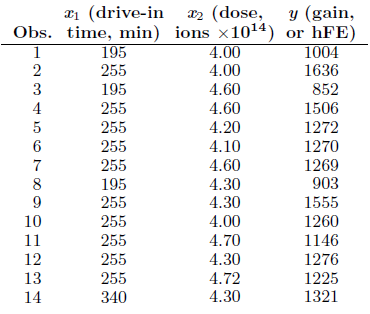
(a) Determine if emitter drive-in time influences gain in a linear relationship. That is, test H0: β1 = 0, where β1 is the slope of the regressor variable.
(b) Do a lack-of-fit test to determine if the linear relationship is adequate. Draw conclusions.
(c) Determine if emitter dose influences gain in a linear relationship. Which regressor variable is the better predictor of gain?
Transcribed Image Text:
y (gain, Obs. time, min) ions x1014) or hFE) 1004 1636 852 1506 a1 (drive-in r2 (dose, 1 195 4.00 4.00 4.60 2 255 3 195 4 255 4.60 255 4.20 1272 6 255 4.10 1270 255 4.60 1269 903 7 8 195 255 4.30 4.30 1555 10 255 4.00 1260 11 255 4.70 1146 1276 1225 12 255 4.30 13 255 4.72 4.30 14 340 1321
> The grades in a statistics course for a particular semester were as follows: Test the hypothesis, at the 0.05 level of significance, that the distribution of grades is uniform. Grade A в с D F 14 18 32 20 16
> A mathematics placement test is given to all entering freshmen at a small college. A student who receives a grade below 35 is denied admission to the regular mathematics course and placed in a remedial class. The placement test scores and the final grade
> A machine is supposed to mix peanuts, hazelnuts, cashews, and pecans in the ratio 5:2:2:1. A can containing 500 of these mixed nuts was found to have 269 peanuts, 112 hazelnuts, 74 cashews, and 45 pecans. At the 0.05 level of significance, test the hypot
> Hydrocarbon emissions from cars are known to have decreased dramatically during the 1980s. A study was conducted to compare the hydrocarbon emissions at idling speed, in parts per million (ppm), for automobiles from 1980 and 1990. Twenty cars of each mod
> An experiment was conducted to compare the alcohol content of soy sauce on two different production lines. Production was monitored eight times a day. The data are shown here. Production line 1: 0.48 0.39 0.42 0.52 0.40 0.48 0.52 0.52 Production line 2
> Two types of instruments for measuring the amount of sulfur monoxide in the atmosphere are being compared in an air-pollution experiment. Researchers 370 Chapter 10 One- and Two-Sample Tests of Hypotheses wish to determine whether the two types of instru
> With reference to Exercise 10.39 on page 358, test the hypothesis that σ21 = σ22 against the alternative that σ21 = σ22, where σ21 and σ22 are the variances for the running times of films
> For Exercise 10.41 on page 358, test the hypothesis at the 0.05 level of significance that σ21 = σ22 against the alternative that σ21 = σ22, where σ21 and σ22 are the variances of the numb
> A study is conducted to compare the lengths of time required by men and women to assemble a certain product. Past experience indicates that the distribution of times for both men and women is approximately normal but the variance of the times for women i
> Large-Sample Test of σ2 = σ20: When n ≥ 30, we can test the null hypothesis that σ2 = σ20, or σ = σ0, by computing which is a value of a random variable whose sampling d
> A soft-drink dispensing machine is said to be out of control if the variance of the contents exceeds 1.15 deciliters. If a random sample of 25 drinks from this machine has a variance of 2.03 deciliters, does this indicate at the 0.05 level of significanc
> Past data indicate that the amount of money contributed by the working residents of a large city to a volunteer rescue squad is a normal random variable with a standard deviation of $1.40. It has been suggested that the contributions to the rescue squad
> The following is a portion of a classic data set called the “pilot plot data” in Fitting Equations to Data by Daniel and Wood, published in 1971. The response y is the acid content of material produced by titration, wh
> Aflotoxins produced by mold on peanut crops in Virginia must be monitored. A sample of 64 batches of peanuts reveals levels of 24.17 ppm, on average, with a variance of 4.25 ppm. Test the hypothesis that σ2 = 4.2 ppm against the alternative that σ2 = 4.2
> Past experience indicates that the time required for high school seniors to complete a standardized test is a normal random variable with a standard deviation of 6 minutes. Test the hypothesis that σ = 6 against the alternative thatσ < 6 if a random samp
> The content of containers of a particular lubricant is known to be normally distributed with a variance of 0.03 liter. Test the hypothesis that σ2 = 0.03 against the alternative that σ2 = 0.03 for the random sample of 10 containers in Exercise 10.23 on
> Show the necessary steps in converting the equation to the equivalent form b1 t = ryn-2 V1-r2
> Suppose that an experimenter postulates a model of the type Yi = β0 + β1x1i + €i i= 1, 2, . . . , n, when in fact an additional variable, say x2, also contributes linearly to the response. The true model is then g
> In Review Exercise 11.62, the student was required to show that simple linear regression model. Does the same hold for a model with zero intercept? Show why or why not. Exercise 11.62: Show, in the case of a least squares fit to the simple linear regr
> Consider the situation of Review Exercise 11.62 but suppose n = 2 (i.e., only two data points are available). Give an argument that the least squares regression line will result in (y1 − ˆy1) = (y2 − Ë&
> Show, in the case of a least squares fit to the simple linear regression model Yi = β0 + β1xi + €i, i= 1, 2, . . . , n, that E (4. – ŷ.) = E es = 0. i=1 1=1
> For a simple linear regression model Yi = β0 + β1xi + €i, i= 1, 2, . . . , n, where the i are independent and normally distributed with zero means and equal variances σ2, show that ¯ Y and
> Assuming that the i are independent and normally distributed with zero means and common variance σ2, show that B0, the least squares estimator of β0 in μY |x = β0 + β1x, is normally distributed
> In a certain type of metal test specimen, the normal stress on a specimen is known to be functionally related to the shear resistance. The following is a set of coded experimental data on the two variables: (a) Estimate the regression line Î&frac
> For the simple linear regression model, prove that E(s2) = σ2.
> Suppose a scientist postulates a model Yi = β0 + β1xi + €i, i = 1, 2, . . . , n, and β0 is a known value, not necessarily zero. (a) What is the appropriate least squares estimator of β1? Justify your answer. (b) What is the variance of the slope estimat
> Physical fitness testing is an important aspect of athletic training. A common measure of the magnitude of cardiovascular fitness is the maximum volume of oxygen uptake during strenuous exercise. A study was conducted on 24 middle-aged men to determine t
> Observations on the yield of a chemical reaction taken at various temperatures were recorded as follows: (a) Plot the data. (b) Does it appear from the plot as if the relationship is linear? (c) Fit a simple linear regression and test for lack of fit.
> Consider the vehicle data from Consumer Reports in Figure 11.30 on page 440. Weight is in tons, mileage in miles per gallon, and drive ratio is also indicated. A regression model was fitted relating weight x to mileage y. A partial SAS printout in Figure
> The business section of the Washington Times in March of 1997 listed 21 different used computers and printers and their sale prices. Also listed was the average hover bid. Partial results from regression analysis using SAS software are shown in Figure 11
> The following data represent the chemistry grades for a random sample of 12 freshmen at a certain college along with their scores on an intelligence test administered while they were still seniors in high school. (a) Compute and interpret the sample co
> An experiment was designed for the Department of Materials Engineering at Virginia Tech to study hydrogen embrittlement properties based on electrolytic hydrogen pressure measurements. The solution used was 0.1 N NaOH, and the material was a certain type
> With reference to Exercise 11.9 on page 399, construct (a) a 95% confidence interval for the average weekly sales when $45 is spent on advertising; (b) a 95% prediction interval for the weekly sales when $45 is spent on advertising. Exercise 11.9: A stu
> The amounts of solids removed from a particular material when exposed to drying periods of different lengths are as shown. (a) Estimate the linear regression line. (b) Test at the 0.05 level of significance whether the linear model is adequate. x (
> A study was made on the amount of converted sugar in a certain process at various temperatures. The data were coded and recorded as follows: (a) Estimate the linear regression line. (b) Estimate the mean amount of converted sugar produced when the code
> The Statistics Consulting Center at Virginia Tech analyzed data on normal woodchucks for the Department of Veterinary Medicine. The variables of interest were body weight in grams and heart weight in grams. It was desired to develop a linear regression e
> With reference to Exercise 11.8 on page 399, construct (a) a 95% confidence interval for the average course grade of students who make a 35 on the placement test; (b) a 95% prediction interval for the course grade of a student who made a 35 on the placem
> The following data were obtained in a study of the relationship between the weight and chest size of infants at birth. (a) Calculate r. (b) Test the null hypothesis that ρ = 0 against the alternative that ρ > 0 at the 0.01 leve
> Test the hypothesis that ρ = 0 in Exercise 11.43 against the alternative that ρ = 0. Use a 0.05 level of significance. Exercise 11.43: Compute and interpret the correlation coefficient for the following grades of 6 students selected at random: Mathemat
> With reference to Exercise 11.13 on page 400, assume a bivariate normal distribution for x and y. (a) Calculate r. (b) Test the null hypothesis that ρ = −0.5 against the alternative that ρ (c) Determine the percent
> With reference to Exercise 11.1 on page 398, assume that x and y are random variables with a bivariate normal distribution. (a) Calculate r. (b) Test the hypothesis that ρ = 0 against the alternative that ρ = 0 at the 0.05 level of
> Compute and interpret the correlation coefficient for the following grades of 6 students selected at random: Mathematics grade 70 92 80 74 65 83 English grade 74 84 63 87 78 90
> For a particular variety of plant, researchers wanted to develop a formula for predicting the quantity of seeds (in grams) as a function of the density of plants. They conducted a study with four levels of the factor x, the number of plants per plot. Fou
> Evaluating nitrogen deposition from the atmosphere is a major role of the National Atmospheric Deposition Program (NADP), a partnership of many agencies. NADP is studying atmospheric deposition and its effect on agricultural crops, forest surface waters,
> It is of interest to study the effect of population size in various cities in the United States on ozone concentrations. The data consist of the 1999 population in millions and the amount of ozone present per hour in ppb (parts per billion). The data are
> The following data were collected to determine the relationship between pressure and the corresponding scale reading for the purpose of calibration. (a) Find the equation of the regression line. (b) The purpose of calibration in this application is to
> A regression model is desired relating temperature and the proportion of impurities passing through solid helium. Temperature is listed in degrees centigrade. The data are as follows: (a) Fit a linear regression model. (b) Does it appear that the propo
> Heat treating is often used to carburize metal parts such as gears. The thickness of the carburized layer is considered an important feature of the gear, and it contributes to the overall reliability of the part. Because of the critical nature of this fe
> Organophosphate (OP) compounds are used as pesticides. However, it is important to study their effect on species that are exposed to them. In the laboratory study Some Effects of Organophosphate Pesticides on Wildlife Species, by the Department of Fisher
> The following data are a result of an investigation as to the effect of reaction temperature x on percent conversion of a chemical process y. (See Myers, Montgomery and Anderson-Cook, 2009.) Fit a simple linear regression, and use a lack-of-fit test to d
> Use an analysis-of-variance approach to test the hypothesis that β1 = 0 against the alternative hypothesis β1 = 0 in Exercise 11.5 on page 398 at the 0.05 level of significance. Exercise 11.5: A study was made on the amount of co
> Suppose we have a linear equation through the origin (Exercise 11.28) μY |x = βx. (a) Estimate the regression line passing through the origin for the following data: (b) Suppose it is not known whether the true regression shou
> Test for linearity of regression in Exercise 11.8 on page 399. Comment. Exercise 11.8: A mathematics placement test is given to all entering freshmen at a small college. A student who receives a grade below 35 is denied admission to the regular mathemat
> Test for linearity of regression in Exercise 11.3 on page 398. Use a 0.05 level of significance. Comment. Exercise 11.3: The amounts of a chemical compound y that dissolved in 100 grams of water at various temperatures x were recorded as follows: (a)
> For the data in Exercise 11.29, find a 95% prediction interval at x = 25.
> The amounts of a chemical compound y that dissolved in 100 grams of water at various temperatures x were recorded as follows: (a) Find the equation of the regression line. (b) Graph the line on a scatter diagram. (c) Estimate the amount of chemical tha
> Use the data set (a) Plot the data. (b) Fit a regression line through the origin. (c) Plot the regression line on the graph with the data. (d) Give a general formula (in terms of the yi and the slope b1) for the estimator of σ2. (e) Give a f
> There are important applications in which due to known scientific constraints, the regression line must go through the origin (i.e., the intercept must be zero). In other words, the model should read and only a simple parameter requires estimation. The
> Consider the regression of mileage for certain automobiles, measured in miles per gallon (mpg) on their weight in pounds (wt). The data are from Consumer Reports (April 1997). Part of the SAS output from the procedure is shown in Figure 11.13. (a) Estim
> With reference to Exercise 11.3 on page 398, use the value of s2 found in Exercise 11.19(a) to compute (a) a 99% confidence interval for the average amount of chemical that will dissolve in 100 grams of water at 50 â—¦ C; (b) a 99% pred
> Using the value of s2 found in Exercise 11.17(a), construct a 95% confidence interval for the amount of converted sugar corresponding to x = 1.6 in Exercise 11.5 on page 398. Exercise 11.17: With reference to Exercise 11.5 on page 398, (a) evaluate s2;
> Using the value of s2 found in Exercise 11.17(a), graph the regression line and the 95% confidence bands for the mean response μY |x for the data of Exercise 11.5 on page 398. Exercise 11.17: With reference to Exercise 11.5 on page 398, (a
> With reference to Exercise 11.6 on page 399, use the value of s2 found in Exercise 11.18(a) to compute (a) a 95% confidence interval for the mean shear resistance when x = 24.5; (b) a 95% prediction interval for a single predicted value of the shear resi
> Using the value of s2 found in Exercise 11.16(a), construct a 95% confidence interval for μY |85 in Exercise 11.2 on page 398. Exercise 11.16: With reference to Exercise 11.2 on page 398, (a) evaluate s2; (b) construct a 95% confidence interval for β0;
> Test the hypothesis that β1 = 6 in Exercise 11.9 on page 399 against the alternative that β1 Use a 0.025 level of significance. Exercise 11.9: A study was made by a retail merchant to determine the relation between weekly adverti
> Test the hypothesis that β0 = 10 in Exercise 11.8 on page 399 against the alternative that β0 Exercise 11.8: A mathematics placement test is given to all entering freshmen at a small college. A student who receives a grade below
> The grades of a class of 9 students on a midterm report (x) and on the final examination (y) are as follows: x 77 50 71 72 81 94 96 99 67 y 82 66 78 34 47 85 99 99 68 (a) Estimate the linear regression line. (b) Estimate the final examination grade of a
> With reference to Exercise 11.3 on page 398, (a) evaluate s2; (b) construct a 99% confidence interval for β0; (c) construct a 99% confidence interval for β1. Exercise 11.3: The amounts of a chemical compound y that dissolved in 1
> With reference to Exercise 11.6 on page 399, (a) evaluate s2; (b) construct a 99% confidence interval for β0; (c) construct a 99% confidence interval for β1. Exercise 11.6: In a certain type of metal test specimen, the normal str
> A dry cleaning establishment claims that a new spot remover will remove more than 70% of the spots to which it is applied. To check this claim, the spot remover will be used on 12 spots chosen at random. If fewer than 11 of the spots are removed, we shal
> In Relief from Arthritis published by Thorsons Publishers, Ltd., John E. Croft claims that over 40% of those who suffer from osteoarthritis receive measurable relief from an ingredient produced by a particular species of mussel found off the coast of New
> Repeat Exercise 10.6 but assume that 200 adults are selected and the fail-to-reject region is defined to be 110 ≤ x ≤ 130, where x is the number of college graduates in our sample. Use the normal approximation. Exercise 10.6: The proportion of adults li
> An urban community would like to show that the incidence of breast cancer is higher in their area than in a nearby rural area. (PCB levels were found to be higher in the soil of the urban community.) If it is found that 20 of 200 adult women in the urban
> In a study on the fertility of married women conducted by Martin O’Connell and Carolyn C. Rogers for the Census Bureau in 1979, two groups of childless wives aged 25 to 29 were selected at random, and each was asked if she eventually planned to have a ch
> In a study to estimate the proportion of residents in a certain city and its suburbs who favor the construction of a nuclear power plant, it is found that 63 of 100 urban residents favor the construction while only 59 of 125 suburban residents are in fav
> In a controlled laboratory experiment, scientists at the University of Minnesota discovered that 25% of a certain strain of rats subjected to a 20% coffee bean diet and then force-fed a powerful cancer-causing chemical later developed cancerous tumors. W
> With reference to Exercise 11.5 on page 398, (a) evaluate s2; (b) construct a 95% confidence interval for β0; (c) construct a 95% confidence interval for β1. Exercise 11.5: A study was made on the amount of converted sugar in a c
> In a winter of an epidemic flu, the parents of 2000 babies were surveyed by researchers at a wellknown pharmaceutical company to determine if the company’s new medicine was effective after two days. Among 120 babies who had the flu and were given the med
> At a certain college, it is estimated that at most 25% of the students ride bicycles to class. Does this seem to be a valid estimate if, in a random sample of 90 college students, 28 are found to ride bicycles to class? Use a 0.05 level of significance.
> The proportion of adults living in a small town who are college graduates is estimated to be p = 0.6. To test this hypothesis, a random sample of 15 adults is selected. If the number of college graduates in the sample is anywhere from 6 to 12, we shall n
> A fuel oil company claims that one-fifth of the homes in a certain city are heated by oil. Do we have reason to believe that fewer than one-fifth are heated by oil if, in a random sample of 1000 homes in this city, 136 are heated by oil? Use a P-value in
> It is believed that at least 60% of the residents in a certain area favor an annexation suit by a neighboring city. What conclusion would you draw if only 110 in a sample of 200 voters favored the suit? Use a 0.05 level of significance.
> A new radar device is being considered for a certain missile defense system. The system is checked by experimenting with aircraft in which a kill or a no kill is simulated. If, in 300 trials, 250 kills occur, accept or reject, at the 0.04 level of signif
> Suppose that, in the past, 40% of all adults favored capital punishment. Do we have reason to believe that the proportion of adults favoring capital punishment has increased if, in a random sample of 15 adults, 8 favor capital punishment? Use a 0.05 leve
> A marketing expert for a pasta-making company believes that 40% of pasta lovers prefer lasagna. If 9 out of 20 pasta lovers choose lasagna over other pastas, what can be concluded about the expert’s claim? Use a 0.05 level of significance.
> Nine subjects were used in an experiment to determine if exposure to carbon monoxide has an impact on breathing capability. The data were collected by personnel in the Health and Physical Education Department at Virginia Tech and were analyzed in the Sta
> A study was conducted at the Department of Veterinary Medicine at Virginia Tech to determine if the “strength” of a wound from surgical incision is affected by the temperature of the knife. Eight dogs were used in the
> With reference to Exercise 11.2 on page 398, (a) evaluate s2; (b) construct a 95% confidence interval for β0; (c) construct a 95% confidence interval for β1. Exercise 11.2: The grades of a class of 9 students on a midterm report (x) and on the final exa
> For testing H0: μ = 14, H1: μ ≠ 14, an α = 0.05 level t-test is being considered. What sample size is necessary in order for the probability to be 0.1 of falsely failing to reject H0 when the true population mean differs from 14 by 0.5? From a preliminar
> How large a sample is required in Exercise 10.22 if the power of the test is to be 0.8 when the true mean meditation time exceeds the hypothesized value by 1.2σ? Use α = 0.05. Exercise 10.22: In the American Heart Association journal Hypertension, resea
> How large should the samples be in Exercise 10.31 if the power of the test is to be 0.95 when the true difference between thread types A and B is 8 kilograms? Exercise 10.31: A manufacturer claims that the average tensile strength of thread A exceeds th
> Repeat Exercise 10.4 but assume that 50 orders are selected and the critical region is defined to be x ≤ 24, where x is the number of orders in the sample that arrived late. Use the normal approximation. Exercise 10.4: A fabric manufacturer believes tha
> How large a sample is required in Exercise 10.24 if the power of the test is to be 0.95 when the true average height differs from 162.5 by 3.1 centimeters? Use α = 0.02. Exercise 10.24: The average height of females in the freshman class of a certain co
> If the distribution of life spans in Exercise 10.19 is approximately normal, how large a sample is required in order that the probability of committing a type II error be 0.1 when the true mean is 35.9 months? Assume that σ = 5.8 months. Exercise 10.19:
> How large a sample is required in Exercise 10.20 if the power of the test is to be 0.90 when the true mean is 5.20? Assume that σ = 0.24. Exercise 10.20: A random sample of 64 bags of white cheddar popcorn weighed, on average, 5.23 ounces with a standar
> In Review Exercise 9.91 on page 313, use the t-distribution to test the hypothesis that the diet reduces a woman’s weight by 4.5 kilograms on average against the alternative hypothesis that the mean difference in weight is less than 4.5
> A taxi company manager is trying to decide whether the use of radial tires instead of regular belted tires improves fuel economy. Twelve cars were equipped with radial tires and driven over a prescribed test course. Without changing drivers, the same car
> In a study conducted by the Department of Human Nutrition and Foods at Virginia Tech, the following data were recorded on sorbic acid residuals, in parts per million, in ham immediately after dipping in a sorbate solution and after 60 days of storage:
> With reference to Exercise 11.1 on page 398, (a) evaluate s2; (b) test the hypothesis that β1 = 0 against the alternative that β1 = 0 at the 0.05 level of significance and interpret the resulting decision. Exercise 11.1: A stud
> According to published reports, practice under fatigued conditions distorts mechanisms that govern performance. An experiment was conducted using 15 college males, who were trained to make a continuous horizontal right-to-left arm movement from a microsw

