Question: Using Figure 14.1, answer the following
Using Figure 14.1, answer the following questions:
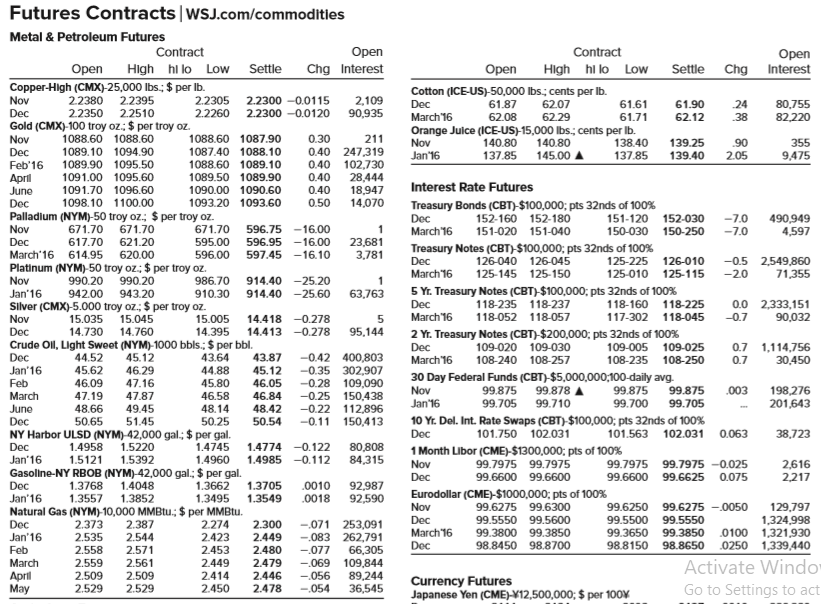
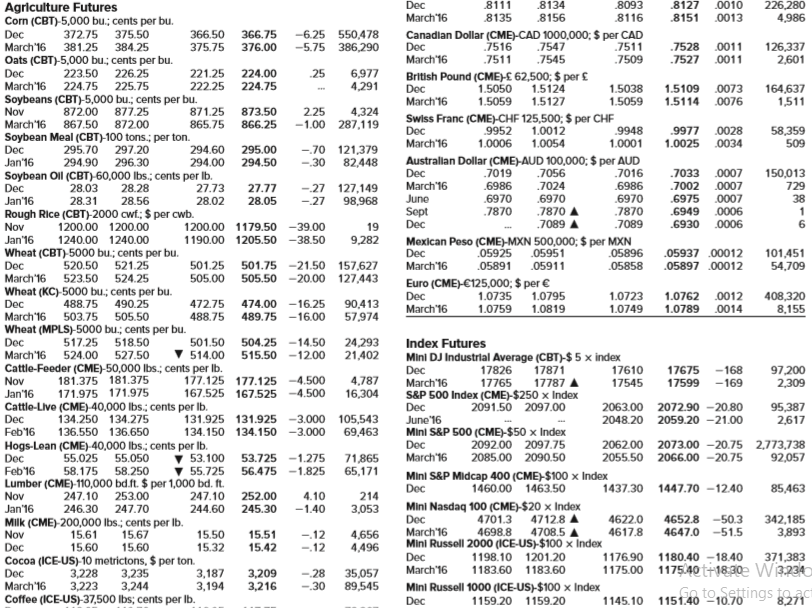
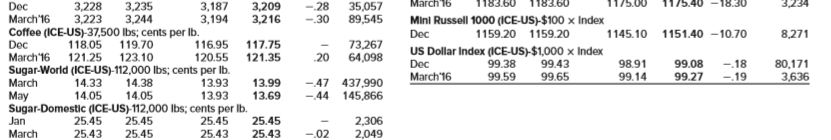
a. What was the settle price for March 2016 coffee futures on this date? What is the total dollar value of this contract at the close of trading for the day?
b. What was the settle price for December 2015 gasoline futures on this date? If you held 10 contracts, what is the total dollar value of your futures position?
c. Suppose you held an open position of 25 March 2016 Mini Dow Jones Industrial Average futures on this day. What is the change in the total dollar value of your position for this day’s trading? If you held a long position, would this represent a profit or a loss to you?
d. Suppose you are short 10 January 2016 soybean oil futures contracts. Would you have made a profit or a loss on this day?
Figure 14.1:
Transcribed Image Text:
Futures Contracts|WSJ.com/commoditles Metal & Petroleum Futures Contract Оpen Contract Open Interest Оpen High hi lo Low Settle Chg Interest Open High hi lo Low Settle Chg Copper-High (CMX)-25,000 Ibs.; $ per Ib. 22380 2.2395 Cotton (ICE-US)-50,000 Ibs; cents per Ib. Dec 61.87 Nov Dec Gold (CMX)-100 troy oz.: $ per troy oz. Nov Dec Feb'16 2.2305 2.2300 -0.0115 2.2260 2,109 2.2300 -0.0120 90,935 62.07 62.29 61.61 61.90 80,755 24 38 22350 2.2510 March'16 62.08 61.71 62.12 82,220 Orange Juice (ICE-US)-15,000 Ibs.; cents per Ib. 1088.60 1087.90 140.80 1088.60 1088.60 0.30 211 Nov 140.80 138.40 139.25 139.40 90 355 0.40 247,319 0.40 102,730 28,444 18,947 14,070 1089.10 1094.90 1087.40 1088.10 Jan'16 137.85 145.00 A 137.85 2.05 9,475 1089.90 1095.50 1088.60 1089.10 1091.00 1095.60 1089.50 1089.90 0.40 April June Dec Palladium (NYM)-50 troy oz; $ per troy oz. Nov 1091.70 1096.60 1090.00 1090.60 0.40 Interest Rate Futures 1098.10 1100.00 1093.20 1093.60 0.50 Treasury Bonds (CBT)-$100,000; pts 32nds of 100% Dec 152-160 152-180 151-120 152-030 -7.0 -7 490,949 4,597 671.70 671.70 671.70 596.75 -16.00 596.95 -16.00 597.45 -16.10 1 March'16 151-020 151-040 150-030 150-250 595.00 596.00 Platinum (NYM)-50 troy oz: $ per troy oz. 986.70 Dec 617.70 621.20 23,681 3,781 Treasury Notes (CBT)-$100,000; pts 32nds of 100% Dec March'16 March'16 614.95 620.00 126-040 126-045 125-225 126-010 -0.5 2,549,86o -20 990.20 990.20 125-145 125-150 125-010 125-115 71,355 914.40 -25.20 914.40 -25.60 Nov 1 Jan'16 5 Yr. Treasury Notes (CBT)-$100,000; pts 32nds of 100% 942.00 943.20 Silver (CMX)-5.000 troy oz.; $ per troy oz. 15.045 910.30 63,763 Dec March'16 118-235 118-237 118-160 118-225 0.0 2,333,151 -0.7 Nov 15.035 15.005 14.418 -0.278 118-052 118-057 117-302 118-045 90,032 2 Yr. Treasury Notes (CBT)-$200,000; pts 32nds of 100% 109-020 109-030 Dec 14.730 14.760 14.395 14.413 -0.278 95,144 Crude Oll, Light Sweet (NYM)-1000 bbls.; $ per bbl. 45.12 46.29 Dec March'16 0.7 1,114,756 30,450 109-005 109-025 Dec Jan'16 Feb 44.52 43.64 44.88 43.87 45.12 -0.42 400,803 -0.35 302,907 -0.28 109,090 -0.25 150,438 -0.22 112,896 -0.11 150,413 108-240 108-257 108-235 108-250 0.7 45.62 30 Day Federal Funds (CBT)-$5,000,000;100-daily avg. Nov Jan'16 47.16 47.87 49.45 51.45 NY Harbor ULSD (NYM)-42,000 gal; $ per gal. 46.09 45.80 46.05 99.875 99.878 , 99.875 99.875 99.705 .003 198,276 201,643 47.19 46.58 March June Dec 46.84 48.42 50.54 99.705 99.710 99.700 48.66 48.14 10 Yr. Del. Int. Rate Swaps (CBT)-$100,000; pts 32nds of 100% 101.750 102.031 50.65 50.25 Dec 101.563 102.031 0.063 38,723 Dec 1.4958 1.5220 1.4745 1.4774 -0.122 80,808 84,315 1 Month Libor (CME)-$1300,000; pts of 100% Jan'16 1.5121 1.5392 1.4960 1.4985 -0.112 Nov 99.7975 99.7975 99.7975 99.7975 -0.025 2,616 2,217 Gasoline-NY RBOB (NYM)-42,000 gal.; $ per gal. Dec Jan'16 Dec 99.6600 99.6600 99.6600 99.6625 0.075 1.3768 1.3557 1.4048 1.3852 1.3705 1.3549 .0010 .0018 92,987 92,590 1.3662 Eurodollar (CME)-$1000,000; pts of 100% 99.6275 99.6300 1.3495 99.6250 129,797 1,324,998 .0100 1,321,930 1,339,440 Nov 99.6275 -.0050 Natural Gas (NYM)-10,000 MMBtu.; $ per MMBtu. 2.387 2.544 2.571 2.561 2.509 2.529 Dec March'16 Dec 99.5550 99.5600 99.3800 99.3850 98.8450 98.8700 99.5500 99.5550 Dec 2.373 2.535 2.558 2.559 2.509 2.529 2.274 2.300 -.071 253,091 -.083 262,791 66,305 109,844 89,244 36,545 99.3650 99.3850 Jan'16 2.423 2.449 2.480 2.479 2.446 2.478 98.8150 98.8650 .0250 Feb 2.453 2.449 2.414 2.450 -.077 -.069 -.056 -.054 Activate Windo Go to Settings to act March April May Currency Futures Japanese Yen (CME)¥12,500,000; $ per 100% Dec 8111 8134 8093 .8127 0010 Agriculture Futures Corn (CBT)-5,000 bu.; cents per bu. 226,280 4,986 March'16 8135 8156 8116 8151 0013 -6.25 550,478 -5.75 386,290 Canadlan Dollar (CME)-CAD 1000,000; $ per CAD 7516 .7547 .7511 .7545 Dec 372.75 375.50 381.25 384.25 366.50 366.75 Dec March'16 .7511 .7509 .7528 0011 .7527 .0011 126,337 2,601 March'16 375.75 376.00 Oats (CBT)-5,000 bu; cents per bu. Dec 223.50 226.25 221.25 222.25 224.00 224.75 25 6,977 4,291 British Pound (CME)£ 62,500; $ per £ 1.5050 1.5059 March'16 224.75 225.75 1.5124 Dec March'16 1.5038 1.5059 1.5109 0073 1.5114 .0076 164,637 1,511 Soybeans (CBT)-5,000 bu.; cents per bu. 872.00 867.50 1.5127 877.25 871.25 873.50 865.75 866.25 4,324 -1.00 287,119 Nov 225 Swiss Franc (CME)-CHF 125,500; $ per CHE 9952 March'16 872.00 1.0012 Doc March'16 9948 1.0001 .9977 0028 1.0025 .0034 58,359 509 Soybean Meal (CBT)-100 tons.; per ton. 295.70 294.90 296.30 1.0006 1.0054 297.20 Dec Jan'16 294.60 294.00 295.00 294.50 -70 121,379 Australlan Dollar (CME)-AUD 100,000; $ per AUD .7019 7056 -30 82,448 Dec 7016 .7033 0007 150,013 Soybean Oll (CBT)-60,000 lbs.; cents per Ib. 27.73 28.02 March'16 June .6986 6970 .7870 7024 .6970 .7870 6986 .6970 .7870 7089 .7002 0007 .6975 0007 .6949 Dec 28.03 28.28 27.77 729 -27 127,149 -27 Jan'16 28.31 28.56 28.05 98,968 38 Sept Dec „0006 Rough Rice (CBT)-2000 cwf; $ per cwb. Nov 1200.00 1200.00 1200.00 1179.50 -39.00 19 .7089 .6930 .0006 6 Jan'16 1240.00 1240.00 1190.00 1205.50 -38.50 9,282 Mexican Peso (CME)-MXN 500,000; $ per MXN 05925 .05951 05896 Wheat (CBT)-5000 bu.; cents per bu. Doc March'16 523.50 524.25 101,451 54,709 Dec .05937 00012 521.25 501.75 -21.50 157,627 505.50 -20.00 127,443 520.50 501.25 505.00 March'16 .05891 05911 .05858 .05897 .00012 Euro (CME)-€125,000; $ per € Dec Wheat (KC)-5000 bu.; cents per bu. 488.75 503.75 505.50 408,320 8,155 1.0735 1.0795 1.0723 1.0762 0012 472.75 488.75 Dec 490.25 474.00 -16.25 90,413 57,974 March'16 1.0759 1.0789 .0014 1.0819 1.0749 March'16 489.75 -16.00 Wheat (MPLS)-5000 bu.; cents per bu. Dec March'16 517.25 518.50 524.00 527.50 501.50 504.25 -14.50 24,293 21,402 Index Futures Mini DJ Industrial Average (CBT)-$ 5 x index Dec March'16 S&P 500 Index (CME)-$250 x Index Dec June'16 Mini S&P 500 (CME)-$50 x Index Dec March'16 V 514.00 515.50 -12.00 Cattle-Feeder (CME)-50,000 Ibs.; cents per Ib. Nov 17871 17826 17765 17787 17610 17545 17675 -168 181.375 181.375 171.975 171.975 97,200 2,309 177.125 177.125 -4.500 4,787 16,304 17599 -169 Jan'16 Cattle-Live (CME)-40,000 Ibs.; cents per Ib. Dec Feb'16 167.525 167.525 -4.500 2091.50 2097.00 2063.00 2072.90 –20.80 131.925 131.925 -3.000 105,543 69,463 95,387 2,617 134.250 134.275 2048.20 2059.20 -21.00 136.550 136.650 134.150 134.150 -3.000 2092.00 2097.75 Hogs-Lean (CME)-40,000 lbs.; cents per Ib. 55.025 55.050 2062.00 2073.00 -20.75 2,773,738 2055.50 2066.00 -20.75 2085.00 2090.50 92,057 Dec Feb'16 53.100 53.725 -1.275 v 55.725 71,865 65,171 58.250 Lumber (CME)-110,000 bd.ft. $ per 1,000 bd. ft. 247.10 253.00 58.175 56.475 -1.825 Mini S&P Midcap 400 (CME)$100 x Index Dec 1460.00 1463.50 1437.30 1447.7o –12.40 85,463 Nov Jan'16 247.10 252.00 4.10 214 3,053 Mini Nasdaq 100 (CME)-$20 × Index 4712.8 A 4708.5 246.30 247.70 244.60 245.30 -1.40 Dec 4701.3 4622.0 4617.8 4652.8 -50.3 Milk (CME)-200,000 Ibs.; cents per Ib. 15.61 15.60 342,185 3,893 Nov March'16 4698.8 4647.0 -51.5 15.67 15.60 15.50 15.32 15.51 -12 -.12 4,656 4,496 Mini Russell 2000 (ICE-US)-$100 x Index Dec Cocoa (ICE-US)-10 metrictons, $ per ton. Dec March'16 Coffee (ICE-US)-37,500 lbs; cents per Ib. 15.42 Dec 1198.10 1201.20 1180.40 -18.40 371,383 1175.00 117540 t+18,30e Wi3234O So to Settings tgact 1176.90 3,228 March'16 1183.60 1183.60 3,235 3,244 3,187 3,194 3,209 3,216 -.28 -30 35,057 89,545 3,223 Mini Russell 1000 (ICE-US)-$100 x Index Dec 1159.20 1159.20 1145.10 1151.40 10.70 8,271 March 16 18.30 3,234 3,187 3,194 Dec 3,228 3,223 3,235 3,244 3,209 3,216 -28 -.30 35,057 89,545 March'16 Mini Russell 1000 (ICE-US)-$100 x Index Dec 1159.20 1159.20 Coffee (ICE-US)-37,500 lbs; cents per Ib. Dec March'16 121.25 1145.10 1151.40 -10.70 8,271 119.70 117.75 121.35 116.95 120.55 Sugar-World (ICE-US)-112,000 Ibs; cents per Ib. 13.93 118.05 73,267 64,098 US Dollar Index (ICE-US)-$1,000 x Index 99.38 123.10 20 Dec 99.43 99.08 99.27 -18 80,171 3,636 98.91 March'16 99.59 99.65 99.14 -19 14.38 14.05 March 14.33 14.05 13.99 13.69 -47 437,990 145,866 May 13.93 Sugar-Domestic (1CE-US)-112,000 lbs; cents per lb. 25.45 25.43 -44 Jan 25.45 25.43 25.45 25.45 2,306 2,049 March 25.43 25.45 -.02
> What are the Sharpe ratios for the Miranda Fund and the S&P 500?
> An open-end mutual fund has the following stocks: If there are 50,000 shares of the mutual fund, what is the NAV?
> The Aqua Liquid Assets Money Market Mutual Fund has a NAV of $1 per share. During the year, the assets held by this fund appreciated by 1.7 percent. If you had invested $25,000 in this fund at the start of the year, how many shares would you own at the e
> The Emerging Growth and Equity Fund is a “low-load” fund. The current offer price quotation for this mutual fund is $15.95, and the front-end load is 2.0 percent. What is the NAV? If there are 19.2 million shares outstanding, what is the current market v
> Suppose the mutual fund in Problem 1 has a current market price quotation of $21.89. Is this a load fund? If so, calculate the front-end load. Data from Problem 1: The World Income Appreciation Fund has current assets with a market value of $8.5 billio
> You invested $10,000 in a mutual fund at the beginning of the year when the NAV was $32.24. At the end of the year, the fund paid $0.24 in short-term distributions and $0.41 in long-term distributions. If the NAV of the fund at the end of the year was $3
> The World Income Appreciation Fund has current assets with a market value of $8.5 billion and has 410 million shares outstanding. What is the net asset value (NAV) for this mutual fund?
> What is the yield to maturity of the bond? What is the current yield of the bond?
> You found the following stock quote for Gigantus Corporation in today’s newspaper. What was the stock selling for on January 1? Use the following bond quote for Problems 9 and 10: Data from Problems 9: What is the yield to maturity
> The contract size for platinum futures is 50 troy ounces. Suppose you need 300 troy ounces of platinum and the current futures price is $2,025 per ounce. How many contracts do you need to purchase? How much will you pay for your platinum? What is your d
> You purchase 3,000 bonds with a par value of $1,000 for $980 each. The bonds have a coupon rate of 7.2 percent paid semiannually and mature in 10 years. How much will you receive on the next coupon date? How much will you receive when the bonds mature?
> If the market risk premium decreases by 1 percent while the risk-free rate remains the same, the security market line: a. Becomes steeper. b. Becomes flatter. c. Parallel shifts downward.
> In Problem 1, what is the capital gains yield? The dividend yield? What is the total rate of return on the investment? Problem 1: Suppose you bought 100 shares of stock at an initial price of $37 per share. The stock paid a dividend of $0.28 per share
> In Problem 3, if the company has a P/E ratio of 21.5, what is the earnings per share (EPS) for the company? Data from Problem 3: You find a stock selling for $74.20 that has a dividend yield of 3.4 percent. What was the last quarterly dividend paid?
> You find a stock selling for $74.20 that has a dividend yield of 3.4 percent. What was the last quarterly dividend paid?
> In Problem 1, assume the company has 100 million shares of stock outstanding and a P/E ratio of 15. What was net income for the most recent four quarters? Data from Problem 1: You found the following stock quote for DRK Enterprises, Inc., at your favor
> If you currently own 15 of the bonds, how much will you receive on the next coupon date? Use the following corn futures quotes for Problems 11–13: Data from Problems 11: How many of the March contracts are currently open? How many
> You short sold 1,000 shares of stock at a price of $36 and an initial margin of 55 percent. If the maintenance margin is 35 percent, at what share price will you receive a margin call? What is your account equity at this stock price?
> The stock of Flop Industries is trading at $48. You feel the stock price will decline, so you short 1,000 shares at an initial margin of 60 percent. If the maintenance margin is 30 percent, at what share price will you receive a margin call?
> You decide to buy 1,200 shares of stock at a price of $34 and an initial margin of 55 percent. What is the maximum percentage decline in the stock before you will receive a margin call if the maintenance margin is 35 percent?
> You have $22,000 and decide to invest on margin. If the initial margin requirement is 55 percent, what is the maximum dollar purchase you can make?
> You purchase 275 shares of 2nd Chance Co. stock on margin at a price of $53. Your broker requires you to deposit $8,000. What is your margin loan amount? What is the initial margin requirement?
> The beta of stock B is closest to: a. 0.51 b. 1.07 c. 1.46
> You purchased a stock at the end of the prior year at a price of $73. At the end of this year, the stock pays a dividend of $1.20 and you sell the stock for $78. What is your return for the year? Now suppose that dividends are taxed at 15 percent and l
> Carson Corporation stock sells for $17 per share, and you’ve decided to purchase as many shares as you possibly can. You have $31,000 available to invest. What is the maximum number of shares you can buy if the initial margin is 60 percent?
> A stock has a current share price of $49.24 and a dividend yield of 1.5 percent. If the risk-free rate is 5.4 percent, what is the futures price if the maturity is four months?
> A non-dividend-paying stock has a current share price of $42.60 and a futures price of $42.95. If the maturity of the futures contract is four months, what is the risk-free rate?
> A non-dividend-paying stock has a futures contract with a price of $94.90 and a maturity of two months. If the risk-free rate is 4.5 percent, what is the price of the stock?
> A non-dividend-paying stock is currently priced at $16.40. The risk-free rate is 3 percent and a futures contract on the stock matures in six months. What price should the futures be?
> You are short 30 March 2016 five-year Treasury note futures contracts. Calculate your profit or loss from this trading day using Figure 14.1. Figure 14.1: Futures Contracts|WSJ.com/commoditles Metal & Petroleum Futures Contract Оpen Contract Open I
> You are short 15 March 2016 corn futures contracts. Calculate your dollar profit or loss from this trading day using Figure 14.1. Figure 14.1: Futures Contracts|WSJ.com/commoditles Metal & Petroleum Futures Contract Оpen Contract Open Interest Оpe
> You are long 20 November 2015 soybean futures contracts. Calculate your dollar profit or loss from this trading day using Figure 14.1. Figure 14.1: Futures Contracts|WSJ.com/commoditles Metal & Petroleum Futures Contract Оpen Contract Open Interest
> A stock futures contract is priced at $27.18. The stock has a dividend yield of 1.25 percent and the risk-free rate is 2.5 percent. If the futures contract matures in six months, what is the current stock price?
> Based on the stock and market data provided above, which of the following data regarding stock A is most accurate? Required Return Recommendation а. 16.1% Sell b. 16.1% Buy C. 14.15% Sell
> Your portfolio allocates equal funds to the DW Co. and Woodpecker, Inc., stocks referred to in Problems 7 and 8. The return correlation between DW Co. and Woodpecker, Inc., is zero. What is the smallest expected loss for your portfolio in the coming mont
> Woodpecker, Inc., stock has an annual return mean and standard deviation of 18 percent and 44 percent, respectively. What is the smallest expected loss in the coming month with a probability of 2.5 percent?
> DW Co. stock has an annual return mean and standard deviation of 12 percent and 30 percent, respectively. What is the smallest expected loss in the coming year with a probability of 5 percent?
> The Layton Growth Fund has an alpha of 2.1 percent. You have determined that Layton’s information ratio is 0.5. What must Layton’s tracking error be relative to its benchmark?
> In Problem 3, assume that the correlation of returns on portfolio Y to returns on the market is .75. What is the percentage of portfolio Y’s return that is driven by the market? Data from Problem 3: You are given the following informa
> Assume that the tracking error of portfolio X in Problem 3 is 9.2 percent. What is the information ratio for portfolio X? Data from Problem 3: You are given the following information concerning three portfolios, the market portfolio, and the risk-free
> You are given the following information concerning three portfolios, the market portfolio, and the risk-free asset: What are the Sharpe ratio, Treynor ratio, and Jensen’s alpha for each portfolio? Portfolio R, Pp 12% 29% 1.25 Y
> You find the monthly standard deviation of a stock is 8.60 percent. What is the annual standard deviation of the stock?
> What is the formula for the Sharpe ratio for a stock and bond portfolio with a zero correlation between stock and bond returns?
> You find a particular stock has an annual standard deviation of 54 percent. What is the standard deviation for a two-month period?
> Which of the following is closest to the expected return of a portfolio that consists of 90 percent of the original portfolio, 5 percent of the Hi Rise (HR) Real Estate Fund, and 5 percent of the Beta Naught (BN) Fund? a. 9.0 percent b. 10.4 percent c. 9
> What is the estimate of Country Point’s free cash flow to the firm (FCFF) in 2012? a. 25 b. 16 c. 11
> You found the following stock quote for DRK Enterprises, Inc., at your favorite website. You also found that the stock paid an annual dividend of $0.75, which resulted in a dividend yield of 1.30 percent. What was the closing price for this stock yesterd
> Suppose you bought 100 shares of stock at an initial price of $37 per share. The stock paid a dividend of $0.28 per share during the following year, and the share price at the end of the year was $41. Compute your total dollar return on this investment.
> Referring to Figure 14.1, what is the total open interest on the December 2015 Japanese yen contract? Does it represent long positions, short positions, or both? Based on the settle price on the contract, what is the dollar value of the open interest? F
> A stock has a beta of 0.9 and an expected return of 9 percent. A risk-free asset currently earns 4 percent. a. What is the expected return on a portfolio that is equally invested in the two assets? b. If a portfolio of the two assets has a beta of 0.5, w
> Consider the following information: a. Your portfolio is invested 25 percent each in A and C and 50 percent in B. What is the expected return of the portfolio? b. What is the variance of this portfolio? The standard deviation? Rate of Return If S
> Based on the following information, calculate the expected return and standard deviation for the two stocks. Rate of Return If State Occurs State of Probablity of State of Economy Economy Stock A Stock B Recession .3 0.04 -0.20 Normal .4 0.09 0.13
> Calculate the expected return on a portfolio of 55 percent Roll and 45 percent Ross by filling in the following table: Data for Question 7: (1) (4) (2) Probablity of State of Economy (3) Portfollo Return State of Product Economy If State Occurs (2
> Calculate the standard deviations for Roll and Ross by filling in the following table (verify your answer using returns expressed in percentages as well as decimals): Data for Question 5: (1) (2) Probablity of State of Economy (3) (4) Squared Ret
> A study analyzed the behavior of the stock prices of firms that had lost antitrust cases. Included in the diagram are all firms that lost the initial court decision, even if the decision was later overturned on appeal. The event at time 0 is the initial,
> An important difference between a long position in stock and a short position concerns the potential gains and losses. Suppose a stock sells for $18 per share and you buy 500 shares. What are your potential gains and losses?
> The following figures present the results of four cumulative abnormal returns (CAR) studies. Indicate whether the results of each study support, reject, or are inconclusive about the semi strong form of the efficient markets hypothesis. In ea
> The following diagram shows the cumulative abnormal returns (CAR) for oil exploration companies announcing oil discoveries over a 30-year period. Month 0 in the diagram is the announcement month. Assume that no other information is received and the stock
> On November 14, Thoro good Enterprises announced that the public and acrimonious battle with its current CEO had been resolved. Under the terms of the deal, the CEO would step down from his position immediately. In exchange, he was given a generous sever
> Suppose you calculated the total market value of the stocks in an index over a five-year period: Year 1: 4,387 million Year 2: 4,671 million Year 3: 5,032 million Year 4: 4,820 million Year 5: 5,369 million Suppose you wanted the index to start at 1,000.
> You purchase 10 call option contracts with a strike price of $75 and a premium of $3.85. If the stock price at expiration is $82, what is your dollar profit? What if the stock price is $72?
> Using the information from Problem 5, calculate the variances and the standard deviations for Cherry and Straw.
> Calculate the index return for the information in Problem 4 using a value-weighted index.
> To an investor, what is the difference between using an advisor and using a broker?
> What is Blume’s formula? When would you want to use it in practice?
> What is the difference between arithmetic and geometric returns? Suppose you have invested in a stock for the last 10 years. Which number is more important to you, the arithmetic or geometric return?
> Explain how volume is quoted for stocks, corporate bonds, futures, and options.
> Why is preferred stock “preferred”?
> What does it mean to sell a security short? Why might you do it?
> What does it mean to purchase a security on margin? Why might you do it?
> Program traders closely monitor relative futures and cash market prices, but program trades are not actually made on a fully mechanical basis. What are some of the complications that might make program trading using, for example, the S&P 500 contract mor
> Is it true that a futures contract represents a zero-sum game, meaning that the only way for a buyer to win is for a seller to lose, and vice versa?
> An American electronics firm imports its completed circuit boards from Japan. The company signed a contract today to pay for the boards in Japanese yen upon delivery in four months; the price per board in yen was fixed in the contract. Should the importe
> What are the similarities and differences in taking the short side of a futures contract and short selling a stock? How do the cash flows differ?
> Using Figure 14.1, answer the following questions: a. How many exchanges trade wheat futures contracts? b. If you have a position in 10 gold futures, what quantity of gold underlies your position? c. If you are short 20 oat futures contracts and you opt
> What is the difference between the Sharpe ratio and the Sortino ratio?
> Suppose that two investments have the same alpha. What things might you consider to help you determine which investment to choose?
> Which of the following represents the best investment advice? a. Avoid Texas because its expected return is lower than its required return. b. Buy Montana and Texas because their required returns are lower than their expected returns. c. Buy Montana beca
> Explain what it means for all assets to have the same reward-to-risk ratio. How can you increase your return if this holds true? Why would we expect that all assets have the same reward-to-risk ratio in liquid, well-functioning markets?
> Suppose you identify a situation in which one security is overvalued relative to another. How would you go about exploiting this opportunity? Does it matter if the two securities are both overvalued relative to some third security? Are your profits certa
> Is it possible that a risky asset could have a beta of zero? Explain. Based on the CAPM, what is the expected return on such an asset? Is it possible that a risky asset could have a negative beta? What does the CAPM predict about the expected return on s
> As indicated by examples in this chapter, earnings announcements by companies are closely followed by, and frequently result in, share price revisions. Two issues should come to mind. First, earnings announcements concern past periods. If the market valu
> Indicate whether the following events might cause stocks in general to change price, and whether they might cause Big Widget Corp.’s stock to change price. a. The government announces that inflation unexpectedly jumped by 2 percent last month. b. Big Wid
> Suppose the government announces that, based on a just-completed survey, the growth rate in the economy is likely to be 2 percent in the coming year, compared to 5 percent for the year just completed. Will security prices increase, decrease, or stay the
> Dudley Trudy, CFA, recently met with one of his clients. Trudy typically invests in a master list of 30 securities drawn from several industries. After the meeting concluded, the client made the following statement: “I trust your stock-picking ability an
> In broad terms, why is some risk diversifiable? Why are some risks non diversifiable? Does it follow that an investor can control the level of unsystematic risk in a portfolio but not the level of systematic risk?
> Why is the minimum variance portfolio important in regard to the Markowitz efficient frontier?
> Why should younger investors be willing to hold a larger amount of equity in their portfolios?
> Look at Table 1.1 and Figures 1.5 and 1.6. When were T-bill rates at their highest? Why do you think they were so high during this period? Table 1.1: Figures 1.5: Figures 1.6: TABLE 11 Year-to-Year Total Returns: 1926-2015 LONG-TERM LONG-TE
> (a) What is the relationship between the price of a bond and its YTM? (b) Explain why some bonds sell at a premium to par value, and other bonds sell at a discount. What do you know about the relationship between the coupon rate and the YTM for premium b
> Suppose you buy a 9 percent coupon, 15-year bond today when it’s first issued. If interest rates suddenly rise to 15 percent, what happens to the value of your bond? Why?
> Is the yield to maturity (YTM) on a bond the same thing as the required return? Is YTM the same thing as the coupon rate? Suppose that today a 10 percent coupon bond sells at par. Two years from now, the required return on the same bond is 8 percent. Wha
> What is the difference between a bond’s promised yield and its realized yield? Which is more relevant? When we calculate a bond’s yield to maturity, which of these are we calculating?
> For a premium bond, which is greater, the coupon rate or the yield to maturity? Why? For a discount bond? Why?
> In the United States, what is the normal face value for corporate and U.S. government bonds? How are coupons calculated? How often are coupons paid?
> For callable bonds, the financial press generally reports either the yield to maturity or the yield to call. Often yield to call is reported for premium bonds, and yield to maturity is reported for discount bonds. What is the reasoning behind this conven
> When we observe interest rates in the financial press, do we see nominal or real rates? Which are more relevant to investors?
> Compare and contrast the Fed funds rate and the discount rate. Which do you think is more volatile? Which market do you think is more active? Why?
> Discuss how each of the following theories for the term structure of interest rates could account for a downward-sloping term structure of interest rates: a. Pure expectations b. Maturity preference c. Market segmentation
> When combined with Beta Naught in a 50/50 portfolio, which of the other three funds will produce a portfolio that has the lowest standard deviation? a. New Horizon only. b. Quality Commodity only. c. Either Hi Rise or Quality Commodity.

