Question: Weekly salaries (in dollars) for a sample
Weekly salaries (in dollars) for a sample of construction workers are listed.
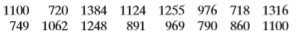
a. Find the mean, median, and mode of the salaries. Which best describes a typical salary?
b. Find the range, variance, and standard deviation of the data set.
c. Find the coefficient of variation of the data set.
Transcribed Image Text:
1100 720 1384 1124 1255 976 718 1316 749 1062 1248 891 969 790 860 1100
> Find the range, mean, variance, and standard deviation of the population data set. The ages of the Supreme Court justices as of December 22, 2016 61 80 68 83 78 66 62 56
> Find the range, mean, variance, and standard deviation of the population data set. The mileages (in thousands of miles) for a rental car company’s fleet. 4 2 9 12 15 3 6 8 1 4 14 12 3 3
> For the histogram in Exercise 22, which is greater, the mean or the median? Explain your reasoning. From Exercise 22: 12 10 8 6- 4- 2- 2 6 10 14 18 22 26 30 34
> For the histogram in Exercise 21, which is greater, the mean or the median? Explain your reasoning. From Exercise 21: 12 10 8 4 2 2 6 10 14 18 22 26 30 34
> The admissions department for a college is asked to recommend the minimum SAT scores that the college will accept for full-time students. Here are the SAT scores of 50 applicants. a. Construct a relative frequency histogram for the data. Use 10 classes.
> Determine whether the approximate shape of the distribution in the histogram is symmetric, uniform, skewed left, skewed right, or none of these. 12 10 8 6- 4- 2- 2 6 10 14 18 22 26 30 34
> Determine whether the approximate shape of the distribution in the histogram is symmetric, uniform, skewed left, skewed right, or none of these. 12 10 8 4 2 2 6 10 14 18 22 26 30 34
> Describe the shape of the distribution for the histogram you made in Exercise 4 as symmetric, uniform, skewed left, skewed right, or none of these.
> Describe the shape of the distribution for the histogram you made in Exercise 3 as symmetric, uniform, skewed left, skewed right, or none of these.
> The frequency distribution shows the numbers of magazine subscriptions per household for a sample of 60 households. Find the mean number of subscriptions per household. Number of magazines 0 1 2 3 4 5 6. Frequency 13 9 19 8 5 2 4
> Estimate the mean of the frequency distribution you made in Exercise 1.
> For the four test scores 96, 85, 91, and 86, the first 3 test scores are 20% of the final grade, and the last test score is 40% of the final grade. Find the weighted mean of the test scores.
> For the six test scores 78, 72, 86, 91, 87, and 80, the first 5 test scores are 15% of the final grade and the last test score is 25% of the final grade. Find the weighted mean of the test scores.
> Find the mean, the median, and the mode of the data, if possible. If any measure cannot be found or does not represent the center of the data, explain why. The responses of 1019 adults who were asked how much money they think they will spend on Christmas
> Find the mean, the median, and the mode of the data, if possible. If any measure cannot be found or does not represent the center of the data, explain why. The vertical jumps (in inches) of a sample of 10 college basketball players at the 2016 NBA Draft
> You work at a bank and are asked to recommend the amount of cash to put in an ATM each day. You do not want to put in too much (which would cause security concerns) or too little (which may create customer irritation). Here are the daily withdrawals (in
> The U.S. real unemployment rates over a 12-year period are listed. Use a time series chart to display the data. Describe any patterns. Year 2005 2006 2007 2008 2009 2010 Rate 9.3% 8.4% 8.4% 9.2% 14.2% 16.7% Year 2011 2012 2013 2014 2015 2016 Rate 16
> The heights (in feet) and the numbers of stories of the ten tallest buildings in New York City are listed. Use a scatter plot to display the data. Describe any patterns. Height (in feet) 1776 1398 1250 1200 1079 1046 1046 1005 975 952 Stories 104 96
> Use the data set, which represents the results of a survey that asked U.S. full-time university and college students about their activities and time use on an average weekday. Use a Pareto chart to display the data set. Describe any patterns. Leisur
> Use the data set, which represents the results of a survey that asked U.S. full-time university and college students about their activities and time use on an average weekday. Use a pie chart to display the data set. Describe any patterns. Leisure E
> Use the data set, which represents the pollution indices for 24 U.S. cities. Use a dot plot to display the data set. Describe any patterns. 22 41 46 50 38 57 65 49 33 28 53 32 23 38 65 28 36 63 54 39 43 56 39 41
> Use the data set, which represents the pollution indices for 24 U.S. cities. Use a stem-and-leaf plot to display the data set. Describe any patterns. 22 41 46 50 38 57 65 49 33 28 53 32 23 38 65 28 36 63 54 39 43 56 39 41
> Use the data set, which represents the numbers of rooms reserved during one night’s business at a sample of hotels. Construct an ogive for the data set using six classes. 153 104 118 166 84 89 104 100 96 108 111 79 93 87 126 101 11
> Use the data set, which represents the numbers of rooms reserved during one night’s business at a sample of hotels. Construct a frequency distribution for the data set with six classes and draw a frequency polygon. 153 104 118 166
> Use the data set shown in the table at the left, which represents the actual liquid volumes (in ounces) in 25 twelve-ounce cans. Construct a relative frequency histogram for the data set using seven classes. Volumes (in ounces) 11.95 11.91 11.86 11.9
> Use the data set shown in the table at the left, which represents the actual liquid volumes (in ounces) in 25 twelve-ounce cans. Construct a frequency histogram for the data set using seven classes. Volumes (in ounces) 11.95 11.91 11.86 11.94 12.00 1
> Use the data set and the indicated number of classes to construct a. an expanded frequency distribution, b. a frequency histogram, c. a frequency polygon, d. a relative frequency histogram, and e. an ogive. Ho
> Use the data set, which represents the overall average class sizes for 20 national universities. Construct a relative frequency histogram using the frequency distribution in Exercise 1. Then determine which class has the greatest relative frequency and
> Use the data set, which represents the overall average class sizes for 20 national universities. Construct a frequency distribution for the data set using five classes. Include class limits, midpoints, boundaries, frequencies, relative frequencies, and
> In Exercise 6, find the probability of the vending company receiving a. no defective units. b. all defective units. c. at least one good unit.
> A shipment of 250 netbooks contains 3 defective units. Determine how many ways a vending company can buy three of these units and receive a. no defective units. b. all defective units. c. at least one good unit.
> From a pool of 30 candidates, the offices of president, vice president, secretary, and treasurer will be filled. In how many different ways can the offices be filled?
> Determine whether the events are mutually exclusive. Then determine whether the events are independent or dependent. Explain your reasoning. Event A: A bowler having the highest game in a 40-game tournament Event B: Losing the bowling tournament
> Which event(s) in Exercise 2 can be considered unusual? Explain. From Exercise 2: The table shows the numbers (in thousands) of earned degrees by level in two different fields, conferred in the United States in a recent year. A person who earned a degr
> The table shows the numbers (in thousands) of earned degrees by level in two different fields, conferred in the United States in a recent year. A person who earned a degree in the year is randomly selected. Find the probability of selecting someone who
> The access code for a warehouse’s security system consists of six digits. The first digit cannot be 0 and the last digit must be even. How many access codes are possible?
> Identify the sampling technique used in each study. Explain your reasoning. a. A journalist asks people at a campground about air pollution. b. For quality assurance, every tenth machine part is selected from an assembly line and measured for accuracy.
> Use technology to create a. a stem-and-leaf plot, b. a dot plot, c. a pie chart, d. a frequency histogram, and e. an ogive for the data. Which graph displays the data best? Explain. 64 46 40 55 70 31 47 44 55 63 49 49 26 72 64 55 44
> An experiment is performed to test the effects of a new drug on high blood pressure. The experimenter identifies 320 people ages 35–50 years old with high blood pressure for participation in the experiment. The subjects are divided into equal groups acco
> Determine whether the study is an observational study or an experiment. Explain. a. Researchers conduct a study to determine whether body mass index (BMI) influences mortality. To conduct the study, researchers obtained the BMIs of 3,951,455 people. b.
> Determine the level of measurement of the data set. Explain your reasoning. a. A list of badge numbers of police officers at a precinct b. The horsepowers of racing car engines c. The top 10 grossing films released in a year d. The years of birth for
> Determine whether the data are qualitative or quantitative. Explain. a. A list of debit card personal identification numbers b. The final scores on a video game
> Determine whether each number describes a population parameter or a sample statistic. Explain your reasoning. a. A survey of 1000 U.S. adults found that 52% think that the introduction of driverless cars will make roads less safe. b. At a college, 90%
> A study of the dietary habits of 359,264 Korean adolescents was conducted to find a link between dietary habits and school performance. Identify the population and the sample in the study.
> Which technique used in Exercise 7 could lead to a biased study? Explain.
> The numbers of regular season wins for each Major League Baseball team in 2016 are listed. Display the data using a box-and-whisker plot. 九的 四万
> Refer to the sample statistics from Exercise 5 and determine whether any of the house prices below are unusual. Explain your reasoning. a. $225,000 b. $80,000 c. $200,000 d. $147,000 From Exercise 5: The mean price of new homes from a sample
> The mean price of new homes from a sample of houses is $180,000 with a standard deviation of $15,000. The data set has a bell-shaped distribution. Using the Empirical Rule, between what two prices do 95% of the houses fall?
> The data sets at the left show the ages of all participants in two yoga classes. a. Make a back-to-back stem-and-leaf plot as described in Exercise 41 to display the data. b. What are the lowest and highest ages of participants in the 3:00&
> The elements with known properties can be classified as metals (57 elements), metalloids (7 elements), halogens (5 elements), noble gases (6 elements), rare earth elements (30 elements), and other nonmetals (7 elements). Display the data using (a) a pie
> Use frequency distribution formulas to approximate the sample mean and the sample standard deviation of the data set in Exercise 1.
> The data set represents the numbers of minutes a sample of 27 people exercise each week. a. Construct a frequency distribution for the data set using five classes. Include class limits, midpoints, boundaries, frequencies, relative frequencies, and cumul
> A person is selected at random from the sample in Exercise 4. Are the events “the student is in sixth grade” and “the student is enrolled in Minnesota” independent or dependent? Explain your reasoning.
> Which event(s) in Exercise 4 can be considered unusual? Explain your reasoning. From Exercise 4: The table shows the sixth, seventh, and eighth grade student enrollment levels (in thousands) in Minnesota and Ohio schools in a recent year. A student in
> The table shows the sixth, seventh, and eighth grade student enrollment levels (in thousands) in Minnesota and Ohio schools in a recent year. A student in one of the indicated grades and states is randomly selected. Find the probability of selecting a s
> Determine whether the events are mutually exclusive. Explain your reasoning. Event A: Randomly select a student born on the 30th of a month Event B: Randomly select a student with a birthday in February
> A security code consists of a person’s first and last initials and four digits. a. What is the probability of guessing a person’s code on the first try? b. What is the probability of not guessing a person’s code on the first try? c. You know a person’
> Sixty-five runners compete in a 10k race. Your school has 12 runners in the race. What is the probability that three runners from your school place first, second, and third?
> A back-to-back stem-and-leaf plot compares two data sets by using the same stems for each data set. Leaves for the first data set are on one side while leaves for the second data set are on the other side. The back-to-back stem-and-leaf plot at the left
> There are 16 students giving final presentations in your history course. a. Three students present per day. How many presentation orders are possible for the first day? b. Presentation subjects are based on the units of the course. Unit B is covered by
> Researchers surveyed 19,183 U.S. physicians, asking for the information below. location (region of the U.S.) income (dollars) employment status (private practice or an employee) benefits received (health insurance, liability coverage, etc.) speci
> Determine whether the survey question is biased. If the question is biased, suggest a better wording. a. How many hours of sleep do you get on a normal night? b. Do you agree that the town’s ban on skateboarding in parks is unfair?
> Determine whether the data are qualitative or quantitative, and determine the level of measurement of the data set. Explain your reasoning. a. The numbers of employees at fast-food restaurants in a city are listed. b. The grade point averages (GPAs) fo
> Identify the sampling technique used, and discuss potential sources of bias (if any). Explain. a. Chosen at random, 200 male and 200 female high school students are asked about their plans after high school. b. Chosen at random, 625 customers at an ele
> Determine whether each number describes a population parameter or a sample statistic. Explain. a. A survey of 1003 U.S. adults ages 18 years and older found that 72% own a smartphone. b. In a recent year, the average evidence-based reading and writing sc
> Use the data set, which represents the points scored by each player on the Montreal Canadiens in the 2015–2016 NHL season. Construct a relative frequency histogram using the frequency distribution in Exercise 17. Then determine which c
> Use the data set, which represents the points scored by each player on the Montreal Canadiens in the 2015–2016 NHL season. Describe the shape of the distribution. 4. 22
> Use the data set, which represents the points scored by each player on the Montreal Canadiens in the 2015–2016 NHL season. Construct a frequency distribution for the data set using eight classes. Include class limits, midpoints, bounda
> A study shows that life expectancies for Americans have increased or remained stable every year for the past five years. a. Make an inference based on the results of the study. b. What is wrong with this type of reasoning?
> A misleading graph is not drawn appropriately, which can misrepresent data and lead to false conclusions. a. explain why the graph is misleading, and b. redraw the graph so that it is not misleading. U.S. Crude Oil Imports by
> Tail lengths (in feet) for a sample of American alligators are listed. a. Find the mean, median, and mode of the tail lengths. Which best describes a typical American alligator tail length? Explain your reasoning. b. Find the range, variance, and stand
> Five test scores are shown below. The first 4 test scores are 15% of the final grade, and the last test score is 40% of the final grade. Find the weighted mean of the test scores. 85 92 84 89 91
> The numbers of tornadoes by state in 2016 are listed. a. Draw a box-and-whisker plot that represents the data set and b. describe the shape of the distribution. 3 23 1 50 40 2 87 7 7 45 48 27 1 46 99 32 31 2 15 44 67 23 4 47 2 3 1 16 32 31 55 4 9 3
> Determine whether the data are qualitative or quantitative, and determine the level of measurement of the data set. The six top-earning states in 2015 by median household income are listed. 1. New Hampshire 2. Alaska 3. Maryland 4. Connecticut 5. Mi
> Determine whether the data are qualitative or quantitative, and determine the level of measurement of the data set. The numbers of stolen bases during the 2016 season for Chicago Cubs players who stole at least one base are listed. 2 8 3 2 13 12 6 2
> Determine whether the study is an observational study or an experiment. Explain. In a study of 7847 children in grades 1 through 5, 15.5% have attention deficit hyperactivity disorder.
> Determine whether the study is an observational study or an experiment. Explain. To study the effect of using digital devices in the classroom on exam performance, researchers divided 726 undergraduate students into three groups, including a group that w
> Identify the population and the sample. A survey of 67,901 Americans ages 12 years or older found that 1.6% had used pain relievers for nonmedical purposes.
> Identify the population and the sample. A survey of 339 college and university admissions directors and enrollment officers found that 72% think their institution is losing potential applicants due to concerns about accumulating student loan debt.
> The mean annual salary for a sample of electrical engineers is $86,500, with a standard deviation of $1500. The data set has a bell-shaped distribution. a. Use the Empirical Rule to estimate the percent of electrical engineers whose annual salaries are
> How is a Pareto chart different from a standard vertical bar graph?
> Use the frequency polygon to identify the class with the greatest, and the class with the least, frequency. MCAT Scores for 90 Applicants 16 14 12 10 8 4 2 472 480 48 496 504 512 520 528 Score Frequency
> Determine whether the number is a parameter or a statistic. Explain your reasoning. In a survey of 1002 U.S. adults, 88% said that fake news has caused a great deal of confusion or some confusion.
> Determine whether the number is a parameter or a statistic. Explain your reasoning. In 2016, the median annual salary of a marketing account executive was $68,232.
> In 2016, a worldwide study of workplace fraud found that initial detections of fraud resulted from a tip (39.1%), an internal audit (16.5%), management review (13.4%), detection by accident (5.6%), account reconciliation (5.5%), surveillance/monitoring (
> Identify the sampling technique used, and discuss potential sources of bias (if any). Explain. Using random digit dialing, researchers asked 1090 U.S. adults their level of education.
> Identify the sampling technique used, and discuss potential sources of bias (if any). Explain. For quality assurance, every fortieth toothbrush is taken from each of four assembly lines and tested to make sure the bristles stay in the toothbrush.
> A psychologist shows a list of eight activities to a subject in an experiment. How many ways can the subject pick a first, second, and third activity?
> Use the minimum and maximum data entries and the number of classes to find the class width, the lower class limits, and the upper class limits. min = 54, max = 247, 10 classes
> Use the minimum and maximum data entries and the number of classes to find the class width, the lower class limits, and the upper class limits. min = 17, max = 135, 8 classes
> Use the minimum and maximum data entries and the number of classes to find the class width, the lower class limits, and the upper class limits. min = 12, max = 88, 6 classes
> Use the minimum and maximum data entries and the number of classes to find the class width, the lower class limits, and the upper class limits. min = 9, max = 64, 7 classes
> A misleading graph is not drawn appropriately, which can misrepresent data and lead to false conclusions. a. explain why the graph is misleading, and b. redraw the graph so that it is not misleading. Sales for Company B 4th q
> Determine whether the statement is true or false. If it is false, rewrite it as a true statement. Class boundaries ensure that consecutive bars of a histogram touch.
> What are some benefits of representing data sets using frequency distributions? What are some benefits of using graphs of frequency distributions?
> Determine whether the statement is true or false. If it is false, rewrite it as a true statement. The method for selecting a stratified sample is to order a population in some way and then select members of the population at regular intervals.
> Determine whether the statement is true or false. If it is false, rewrite it as a true statement. A convenience sample is always representative of a population.
> Determine whether the statement is true or false. If it is false, rewrite it as a true statement. Using a systematic sample guarantees that members of each group within a population will be sampled.
> Determine whether the statement is true or false. If it is false, rewrite it as a true statement. A double-blind experiment is used to increase the placebo effect.
> Determine whether the statement is true or false. If it is false, rewrite it as a true statement. A placebo is an actual treatment.

