Question: Big10Sweaters.com is a new company started
Big10Sweaters.com is a new company started last year by two recent college graduates. The idea behind the company was simple. It will sell premium logo sweaters for Big Ten colleges with one major, unique feature. This unique feature is a special large monogram that has the customer’s name, major, and year of graduation. The sweater is the perfect gift for graduating students and alumni, particularly avid football fans who want to show support during the football season. The company is off to a great start and had a successful first year while selling to only a few schools. This year it plans to expand to a few more schools and target the entire Big Ten Conference within three years. You have been hired by Big10Sweaters.com and need to make a good impression by making good supply chain decisions. This is your big opportunity with a startup. There are only two people in the firm and you were hired with the prospect of possibly becoming a principal in the future. You majored in supply chain (operations) management in school and had a great internship at a big retailer that was getting into Internet sales. The experience was great, but now you are on your own and have none of the great support that the big company had. You need to find and analyze your own data and make some big decisions. Of course, Rhonda and Steve, the partners who started the company, are knowledgeable about this venture and they are going to help along the way. Rhonda had the idea to start the company two years ago and talked her friend from business school, Steve, into joining her. Rhonda is into Web marketing, has a degree in computer science, and has been working on completing an online MBA. She is as much an artist as a techie. She can really make the Website sing. Steve majored in accounting and likes to pump the numbers. He has done a great job of keeping the books and selling the company to some small venture capital people in the area. Last year, he was successful in getting them to invest $2,000,000 in the company (a onetime investment). There were some significant strings attached to this investment in that it stipulated that only $100,000 per year could go toward paying the salary of the two principals. The rest had to be spent on the Website, advertising, and inventory. In addition, the venture capital company gets 25 percent of the company profits, before taxes, during the first four years of operation, assuming the company makes a profit. Your first job is to focus on the firm’s inventory. The company is centered on selling the premium sweaters to college football fans through a Website. Your analysis is important since a significant portion of the company’s assets is the inventory that it carries. The business is cyclic, and sales are concentrated during the period leading up to the college football season, which runs between late August and the end of each year. For the upcoming season, the firm wants to sell sweaters to only a few of the largest schools in the Midwest region of the United States. In particular, it is targeting the Ohio State University (OSU), University of Michigan (UM), Michigan State University (MSU), Purdue University (PU), and Indiana University (IU). These five schools have major football programs and a loyal fan base. The firm has considered the idea of making the sweaters in its own factory, but for now it purchases them from a supplier in China. The prices are great, but service is a problem because the supplier has a 20-week lead time for each order and the minimum order size is 5,000 sweaters. The order can consist of a mix of the different logos, such as 2,000 for OSU, 1,500 for UM, 750 for MSU, 500 for PU, and 250 for IU. Within each logo sublot, sizes are allocated based on percentages, and the supplier suggests 20 percent X-large, 50 percent large, 20 percent medium, and 10 percent small based on its historical data. Once an order is received, a local subcontractor applies the monograms and ships the sweaters to the customer. The subcontractor stores the inventory of sweaters for the company in a small warehouse area located at their site.
This is the company’s second year of operation. Last year, it sold sweaters for only three of the schools, OSU, MU, and PU. It ordered the minimum 5,000 sweaters and sold all of them, but the experience was painful because the company had too many MU sweaters and not enough for OSU fans. Last year, it ordered 2,300 OSU, 1,800 MU, and 900 PU sweaters. Of the 5,000 sweaters, 342 had to be sold at a steep discount on eBay after the season. The company was hoping not to do this again. For the next year, you have collected some data relevant to the decision. Exhibit 20.12 shows cost information for the product when purchased from the supplier in China. Here we see that the cost for each sweater, delivered to the warehouse of our monogramming subcontractor, is $60.88. This price is valid for any quantity we order above 5,000 sweaters. This order can be a mix of sweaters for each of the five schools we are targeting. The supplier needs 20 weeks to process the order, so the
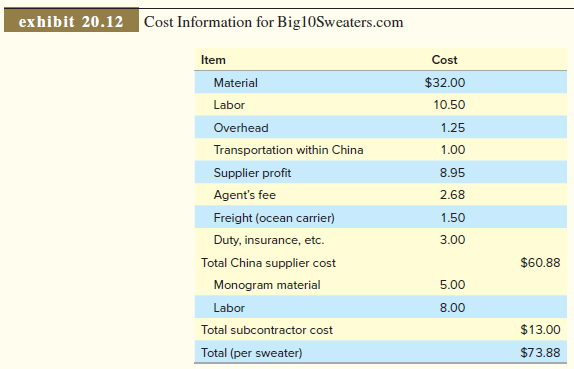
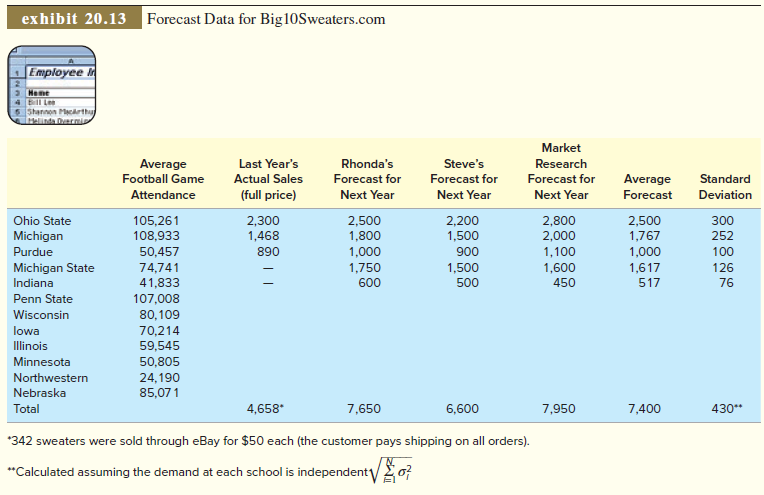
order needs to be placed around April 1 for the upcoming football season. Our monogramming subcontractor gets $13 for each sweater. Shipping cost is paid by the customer when the order is placed. In addition to the cost data, you also have some demand information, as shown in Exhibit 20.13. The exact sales numbers for last year are given. Sweaters sold at full retail price were sold for $120 each. Sweaters left over at the end of the season were sold through eBay for $50 each and these sweaters were not monogrammed by our subcontractor. Keep in mind that the retail sales numbers do not accurately reflect actual demand because they stocked out of the OSU sweaters toward the end of the season. As for advertising the sweaters for next season, Rhonda is committed to using the same approach used last year. The firm placed ads in the football program sold at each game. These worked very well for reaching those attending the games, but she realized there may be ways to advertise that may open sales to more alumni. She has hired a market research firm to help identify other advertising outlets but has decided to wait at least another year to try something different. Forecasting demand is a major problem for the company. You have asked Rhonda and Steve to predict what they think sales might be next year. You have also asked the market research firm to apply their forecasting tools. Data on these forecasts are given in Exhibit 20.13. To generate some statistics, you have averaged the forecasts and calculated the standard deviation for each school and in total. Based on advice from the market research firm, you have decided to use the aggregate demand forecast and standard deviation for the aggregate demand. The aggregate demand was calculated by adding the average forecast for each item. The aggregate standard deviation was calculated by squaring the standard deviation for each item (this is the variance), summing the variance for each item, and then taking the square root of this sum. This assumes that the demand for each school is independent, meaning that the demand for Ohio State is totally unrelated to the demand at Michigan and the other schools. You will allocate your aggregate order to the individual schools based on their expected percentage of total demand. You discussed your analysis with Rhonda and Steve and they are OK with your analysis. They would like to see what the order quantities would be if each school was considered individually. You have a spreadsheet set up with all the data from the exhibits called Big10Sweater.xls and you are ready to do some calculations.
Questions
1. You are curious as to how much Rhonda and Steve made in their business last year. You do not have all the data, but you know that most of their expenses relate to buying the sweaters and having them monogrammed. You know they paid themselves $50,000 each and you know the rent, utilities, insurance, and a benefit package for the business was about $20,000. About how much do you think they made “before taxes†last year? If they must make their payment to the venture capital firm, and then pay 50 percent in taxes, what was their increase in cash last year?
2. What was your reasoning behind using the aggregate demand forecast when determining the size of your order rather than the individual school forecasts? Should you rethink this or is there a sound basis for doing it this way?
3. How many sweaters should you order this year? Break down your order by individual school. Document your calculations in your spreadsheet. Calculate this based on the aggregate forecast and also the forecast by individual school.
4. What do you think they could make this year? They are paying you $40,000 and you expect your benefit package addition would be about $1,000 per year. Assume that they order based on the aggregate forecast.
5. How should the business be developed in the future? Be specific and consider changes related to your supplier, the monogramming subcontractor, target customers, and products
Transcribed Image Text:
exhibit 20.12 Cost Information for Big10Sweaters.com Item Cost Material $32.00 Labor 10.50 Overhead 1.25 Transportation within China 1.00 Supplier profit 8.95 Agent's fee 2.68 Freight (ocean carrier) 1.50 Duty, insurance, etc. 3.00 Total China supplier cost $60.88 Monogram material 5.00 Labor 8.00 Total subcontractor cost $13.00 Total (per sweater) $73.88 exhibit 20.13 Forecast Data for Big10Sweaters.com Employee Heme BI Lee 5 Stannon Macarthu Market Average Last Year's Rhonda's Steve's Research Football Game Actual Sales Forecast for Forecast for Forecast for Average Forecast Standard Attendance (full price) Next Year Next Year Next Year Deviation Ohio State Michigan 105,261 108,933 2,300 1,468 2,500 1,800 1,000 2,500 1,767 2,200 2,800 2,000 300 1,500 252 Purdue 50,457 890 900 1,100 1,000 100 Michigan State 74,741 41,833 1,750 1,500 1,600 450 1,617 126 Indiana 600 500 517 76 Penn State 107,008 80,109 70,214 59,545 Wisconsin lowa Illinois Minnesota 50,805 Northwestern 24,190 85,071 Nebraska Total 4,658* 7,650 6,600 7,950 7,400 430** *342 sweaters were sold through eBay for $50 each (the customer pays shipping on all orders). "Calculated assuming the demand at each school is independent o}
> What type of inventory are we trying to minimize as the result of work-center scheduling?
> If you have five exams to study for, how many alternative schedules exist?
> What priority rule do you use in scheduling your study time for midterm examinations?
> What practical considerations are deterrents to using the SOT rule?
> Meritor is so pleased with the outcome from previous suggestions that the consultants are invited back for more work. The consultants now suggest a more complete robotic automation of the making of muffler assemblies and also a reduction in container siz
> How might planning for a special customer affect the personnel schedule in a service?
> Explain why scheduling personnel in a service operation can be challenging.
> Data integrity is a big deal in industry. Why?
> The following represents a project that should be scheduled using CPM: a. Draw the network. b. What is the critical path? c. What is the expected project completion time? d. What is the probability of completing this project within 16 days? TIMES (
> Suppose that operators have enough training to operate both the bronze machines and the injection molding machine for the plastic sprinklers. Currently, AlwaysRain has 10 such employees. In anticipation of the ad campaign described in problem 5, manageme
> Flowcharts are a common process design and analysis tool used in both manufacturing and services. What is a key feature on flowcharts used in service operations that differentiates between the front-office and back-office aspects of the system?
> How would a flowchart help in planning the servicescape layout? What sorts of features would act as focal points or otherwise draw customers along certain paths through the service? In a supermarket, what departments should be located first along the c
> Why is it desired to have smooth, continuous flow on the shop floor?
> The chapter discusses the use of Gantt charts in shop floor control. You were introduced to Gantt charts in Chapter 4, “Project Management.” Projects and workcenter processes are rather different in nature. Why is it that the same tool can be used in bot
> Under what conditions is the assignment method appropriate?
> Distinguish between dependent and independent demand in a McDonald’s, in an integrated manufacturer of personal copiers, and in a pharmaceutical supply house.
> Why is managing bottlenecks so important in workcenter scheduling?
> What job characteristics would lead you to schedule jobs according to “longest processing time first”?
> Why does batching cause so much trouble in workcenters?
> The SOT rule provides an optimal solution in a number of evaluation criteria. Should the manager of a bank use the SOT rule as a priority rule? Why?
> List at least four of the seven prominent types of waste that should be eliminated from the supply chain.
> Distinguish between a work center, a GT cell, and an assembly line.
> What are the objectives of work-center scheduling?
> Good doctor–patient relations begin with both parties being punctual for appointments. I am Dr. Schafer, and being punctual is particularly important in my specialty: pediatrics. Mothers whose children have only minor problems don’t like them to sit in
> An important difference between service and manufacturing operations is that customers induce far more variability into the operation in a service system. Name at least three of the basic types of variation that customers bring to a service system.
> In anticipation of the ad campaign, AlwaysRain bought an additional bronze machine. Will this be enough to ensure that adequate capacity is available?
> What are some capacity balance problems faced by the following organizations or facilities? a. An airline terminal b. A university computing lab c. A clothing manufacturer
> Assume that product Z is made of two units of A and four units of B. A is made of three units of C and four of D. D is made of two units of E. Lead times for the purchase or fabrication of each unit to final assembly are: Z takes two weeks; A, B, C, and
> In the following MRP planning schedule for item J, indicate the correct net requirements, planned-order receipts, and planned-order releases to meet the gross requirements. Lead time is one week. Week Number Item J 2 3 4 Gross requirements 75 50 70
> Semans is a manufacturer that produces bracket assemblies. Demand for bracket assemblies (X) is 130 units. The following is the BOM in indented form: The following is a table indicating current inventory levels: a. Using Excel, create the MRP using t
> Match the industry type to the expected benefits from an MRP system as High, Medium, or Low. Industry Type Expected Benefit (High, Medium, or Low) Assemble-to-stock Assemble-to-order Make-to-stock Make-to-order Engineer-to-order Proce
> Product A consists of two units of subassembly B, three units of C, and one unit of D. B is composed of four units of E and three units of F. C is made of two units of H and three units of D. H is made of five units of E and two units of G. a. Construct
> What term refers to the optimization of value-adding activities and elimination of non-value adding activities that are part of a value stream?
> The MRP gross requirements for item X are shown here for the next 10 weeks. Lead time for A is two weeks, and setup cost is $9. There is a carrying cost of $0.02 per unit per week. Beginning inventory is 70 units. Use the least total cost or the least
> The MRP gross requirements for item A are shown here for the next 10 weeks. Lead time for A is three weeks and setup cost is $10. There is a carrying cost of $0.01 per unit per week. Beginning inventory is 90 units. Use the least total cost or the leas
> Audio Products, Inc., produces two AM/FM/CD players for cars. The radio/CD units are identical, but the mounting hardware and finish trim differ. The standard model fits intermediate and full-sized cars, and the sports model fits small sports cars.
> Product A is an end item and is made from two units of B and four of C. B is made of three units of D and two of E. C is made of two units of F and two of E. A has a lead time of one week. B, C, and E have lead times of two weeks, and D and F have lead t
> How have price and variety competition changed McDonald’s basic formula for success?
> As the degree of customer contact increases in a service system, what worker skills would be more important, clerical skills or diagnostic skills?
> Each unit of A is composed of one unit of B, two units of C, and one unit of D. C is composed of two units of D and three units of E. Items A, C, D, and E have on-hand inventories of 20, 10, 20, and 10 units, respectively. Item B has a scheduled rece
> Suppose that AlwaysRain Irrigation’s marketing department will undertake an intense ad campaign for the bronze sprinklers, which are more expensive but also more durable than the plastic ones. Forecast demand for the next four years is
> One unit of A is composed of two units of B and three units of C. Each B is composed of one unit of F. C is made of one unit of D, one unit of E, and two units of F. Items A, B, C, and D have 20, 50, 60, and 25 units of on-hand inventory, respectivel
> One unit of A is made of two units of B and one unit of C. B is made of three units of D and one unit of F. C is composed of three units of B, one unit of D, and four units of E. D is made of one unit of E. Item C has a lead time of one week; items A, B,
> One unit of A is made of one unit of B and one unit of C. B is made of four units of C and one unit each of E and F. C is made of two units of D and one unit of E. E is made of three units of F. Item C has a lead time of one week; items A, B, E, and F ha
> What phrase refers to the idea that every step in supply chain processes that deliver goods and services to the customer should create value?
> What is value stream mapping?
> One unit of A is made of two units of B, three units of C, and two units of D. B is composed of one unit of E and two units of F. C is made of two units of F and one unit of D. E is made of two units of D. Items A, C, D, and F have one-week lead times; B
> One unit of A is made of three units of B, one unit of C, and two units of D. B is composed of two units of E and one unit of D. C is made of one unit of B and two units of E. E is made of one unit of F. Items B, C, E, and F have one-week lead times; A a
> Consider a department store. Which departments probably should not be located near each other? Would any departments benefit from close proximity?
> What category of planning covers a period from a day to six months, with daily or weekly time increments?
> Major operations and supply planning activities can be grouped into categories based on the relevant time range of the activity. What time range category does sales and operations planning fit into?
> What strategy do the following organizations seem to use to manage customer-introduced variability? a. EBay b. Ritz-Carlton Hotels c. New airline check-in procedures
> List some practical limits to economies of scale; that is, when should a plant stop growing?
> The essence of yield management is the ability to manage what?
> In a yield management system, pricing differences must appear logical and justified to the customer. The basis for this justification is commonly called what?
> Under what type of demand is yield management most effective?
> The widespread scientific application of yield management began within what industry?
> Refer to Example 14.1 as the basis for this problem. Meritor hires a team of consultants. The consultants suggest a partial robotic automation, as well as an increase in safety stock to 12.5 percent. Meritor implements these suggestions. The result is an
> How would you show a pull system in VSM Symbols between the blanking and CNC stages of the bolt manufacturing solved problems?
> Which of the four costs relevant to aggregate production planning is the most difficult to accurately measure?
> List at least three of the four costs relevant to the aggregate production plan.
> What is the term for a more complex production strategy that combines approaches from more than one basis strategy?
> In the agriculture industry, migrant workers are commonly employed to pick crops ready for harvest. They are hired as needed and are laid off once the crops are picked. This approach is made necessary by the realities of the industry. Which production p
> Plan production for the next year. The demand forecast is: spring, 20,000; summer, 10,000; fall, 15,000; winter, 18,000. At the beginning of spring you have 70 workers and 1,000 units in inventory. The union contract specifies that you may lay off work
> Suppose you were the manager of a restaurant and you were told honestly that a couple eating dinner had just seen a mouse. What would you say to them? How would you recover from this service crisis?
> Plan production for a four-month period: February through May. For February and March, you should produce to exact demand forecast. For April and May, you should use overtime and inventory with a stable workforce; stable means that the number of workers
> What capacity problems are encountered when a new drug is introduced to the market?
> Develop a production plan and calculate the annual cost for a firm whose demand forecast is fall, 10,000; winter, 8,000; spring, 7,000; summer, 12,000. Inventory at the beginning of fall is 500 units. At the beginning of fall, you currently have 30 worke
> Helter Industries, a company that produces a line of women’s bathing suits, hires temporaries to help produce its summer product demand. For the current four-month rolling schedule, there are three temps on staff and 12 full-time employ
> A bottling plant fills 2,400 bottles every two hours. The lead time is 40 minutes and a container accommodates 120 bottles. The safety stock is 10 percent of expected demand. How many kanban cards are needed?
> Develop a production schedule to produce the exact production requirements by varying the workforce size for the following problem. Use the example in the chapter as a guide (Plan 1). The monthly forecasts for Product X for January, February, and March a
> Shoney Video Concepts produces a line of video streaming servers that are linked to computers for storing movies. These devices have very fast access and large storage capacity. Shoney is trying to determine a production plan for the next 12 months.
> Alan Industries is expanding its product line to include three new products: A, B, and C. These are to be produced on the same production equipment, and the objective is to meet the demands for the three products using overtime where necessary. The deman
> Old Pueblo Engineering Contractors creates six-month “rolling” schedules, which are recomputed monthly. For competitive reasons (it would need to divulge proprietary design criteria, methods, and so on), Old Pueblo
> DAT, Inc., needs to develop an aggregate plan for its product line. Relevant data are The forecast for next year is Management prefers to keep a constant workforce and production level, absorbing variations in demand through inventory excesses and sh
> In what way does the time horizon chosen for an aggregate plan determine whether it is the best plan for the firm?
> Can a manufacturer have a service guarantee in addition to a product guarantee?
> What are the major differences between aggregate planning in manufacturing and aggregate planning in services?
> How would you apply yield management concepts to a barbershop? A soft drink vending machine?
> Refer to Exhibit 5.6. Why is it that the “critical zone” begins at a utilization rate of about 70 percent in a typical service operation? Draw upon your own experiences as either a customer or a server in common serv
> Transmissions are delivered to the fabrication line four at a time. It takes one hour for transmissions to be delivered. Approximately four vehicles are produced each hour, and management has decided that 50 percent of expected demand should be maintaine
> Define yield management. How does it differ from the pure strategies in production planning?
> What are the basic controllable variables of a production planning problem? What are the four major costs?
> How does forecast accuracy relate, in general, to the practical application of the aggregate planning models discussed in the chapter?
> Distinguish between pure and mixed strategies in production planning.
> You are the operations manager for a manufacturing plant that produces pudding food products. One of your important responsibilities is to prepare an aggregate plan for the plant. This plan is an important input into the annual budget process. The plan p
> Here are the data for the past 21 months for actual sales of a particular product: Develop a forecast for the fourth quarter using a three-quarter, weighted moving average. Weight the most recent quarter 0.5, the second most recent 0.25, and the third
> What category of forecasting techniques uses managerial judgment in lieu of numerical data?
> Could a service firm use production line approach or self-serve design and still keep a high customer focus (personal attention)? Explain and support your answer with examples.
> What is the term for forecasts used for making day-to-day decisions about meeting demand?
> What is the first step in CPFR?
> The Sun River beverage company is a regional producer of teas, exotic juices, and energy drinks. With an interest in healthier lifestyles, there has been an increase in demand for its sugar-free formulation. The final packing operation requires 13 tasks
> How many steps are there in collaborative planning, forecasting, and replenishment (CPFR)?
> What are some major capacity considerations in a hospital? How do they differ from those of a factory?
> Often times, firms will work with their partners across the supply chain to develop forecasts and execute production and distribution between the partners. What technique does this describe?
> When forecasting demand for new products, sometimes firms will use demand data from similar existing products to help forecast demand for the new product. What technique is this an example of?
> Which qualitative forecasting technique was developed to ensure the input from every participant in the process is weighted equally?
> What forecasting technique makes use of written surveys or telephone interviews?
> The following table shows predicted product demand using your particular forecasting method along with the actual demand that occurred. (Answers in Appendix D) a. Compute the tracking signal using the mean absolute deviation and running sum of forecast
> In this problem, you are to test the validity of your forecasting model. Here are the forecasts for a model you have been using and the actual demands that occurred: Use the method stated in the text to compute MAD and the tracking signal. Then, decide

